A low property tax rate does not mean a low tax bill
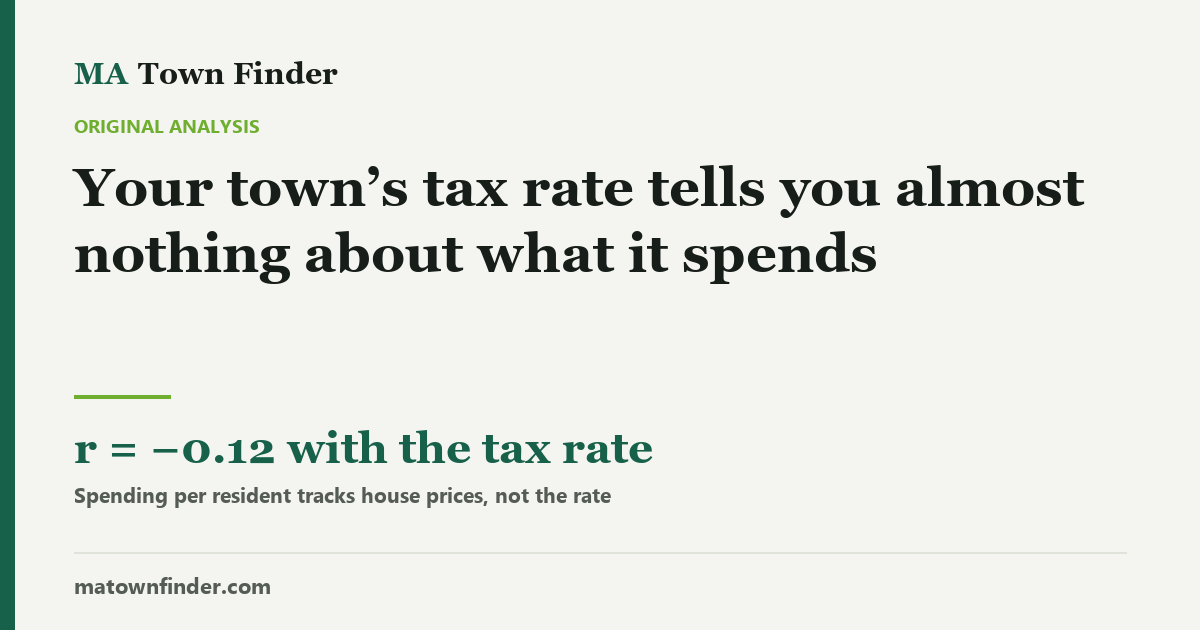
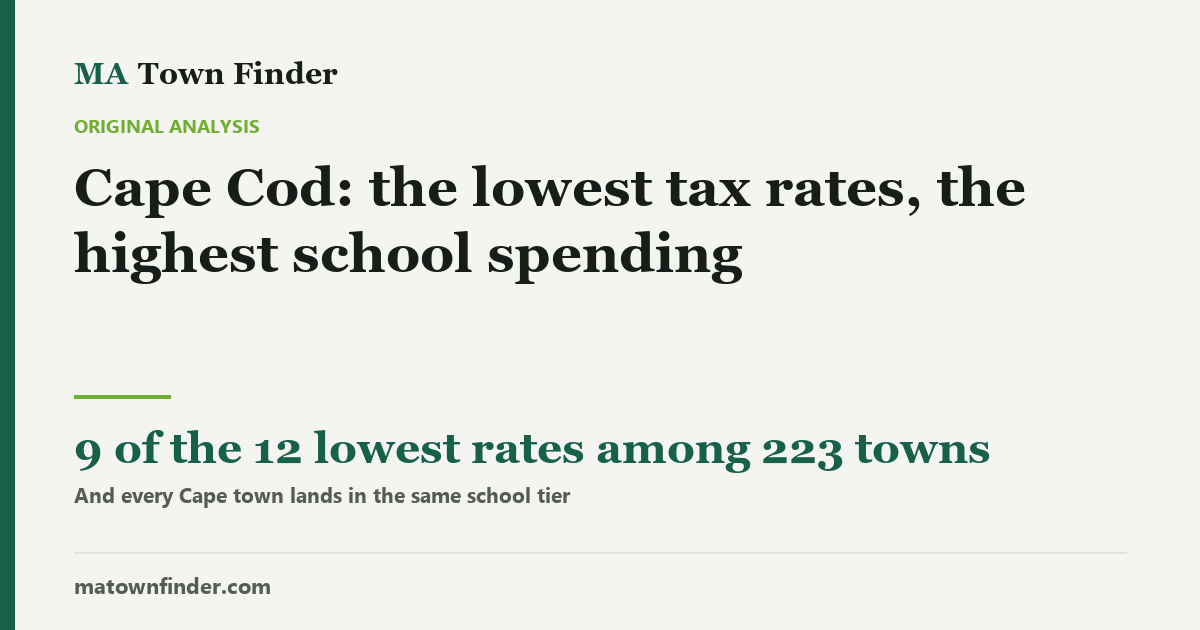
Every Massachusetts tax table ranks towns by rate. We ranked all 223 by what they actually cost — and in 40% of matchups, the town with the lower rate pays the higher bill.
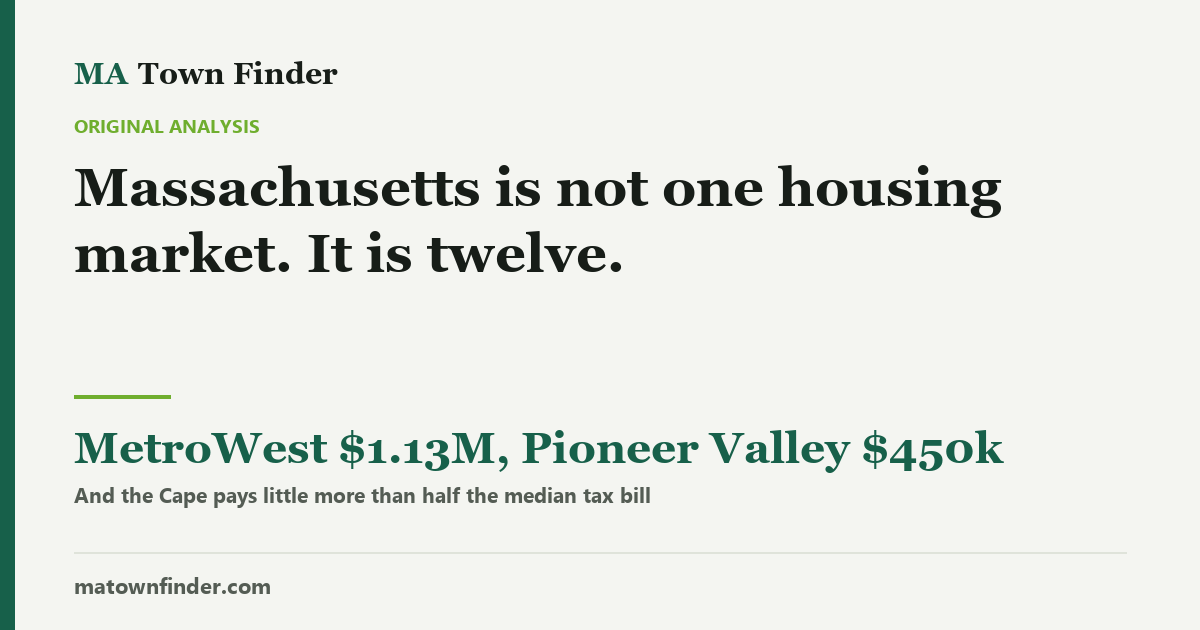
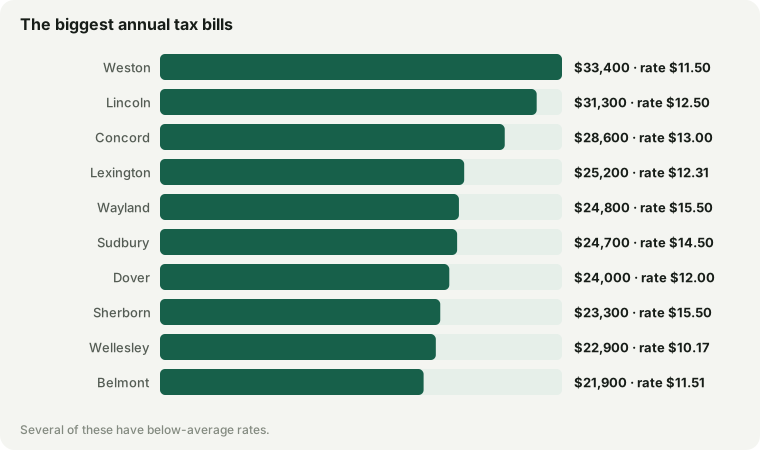
Search for Massachusetts property taxes and you will find the same artefact everywhere: a table of towns ranked by residential rate, lowest first. It is the wrong table. A rate is a price per $1,000 of assessed value, and in a state where the median house ranges from about $300k to $2.9M depending on the town, the price per $1,000 tells you very little about the bill.
So we did the arithmetic the tables skip. For each of the 223 Massachusetts municipalities we cover, we applied the town’s own FY2026 residential rate to the town’s own median 4-bedroom house, and ranked by the result.
The headline
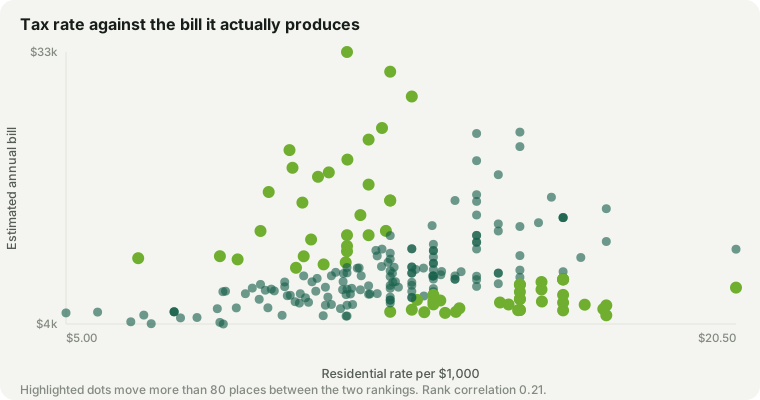
Take any two Massachusetts towns at random. In 40% of those 24,753 matchups, the town with the lower tax rate has the higher tax bill. Not a handful of exceptions — a coin flip. The rank correlation between rate and bill across the state is 0.29, where 1.0 would mean the rate tells you the bill and 0 would mean it tells you nothing.
Of the ten towns with the lowest rates among the 223 we cover, only 4 are also in the ten with the lowest bills. Widen it to the lowest twenty-five of each and only 13 towns appear on both lists.
The reason is arithmetic, not conspiracy. Rates across the state vary by a factor of about 5.3. Bills vary by a factor of about 10.5. The house is doing most of the work, and the rate is the smaller term.
The towns a rate table flatters
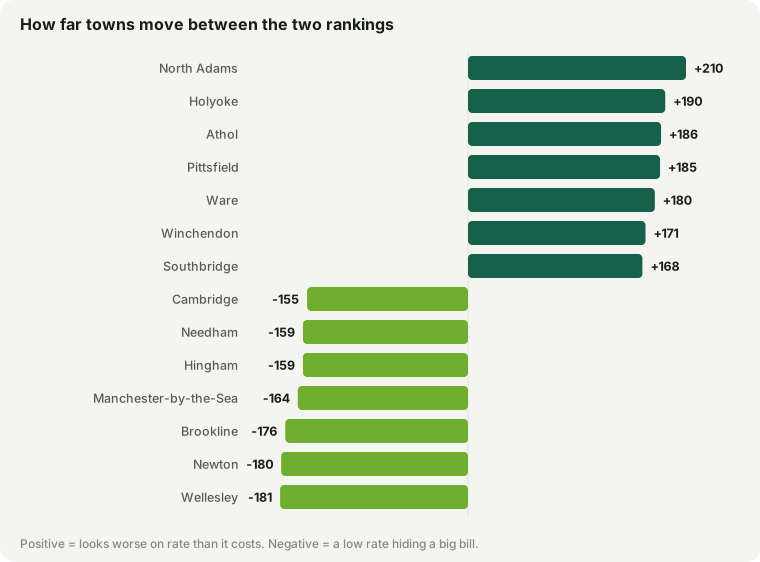
These have rates that look reassuring and bills that are anything but. The move column is how far the town falls when you rank by bill instead of by rate — out of 223.
| Town | Rate | Rank by rate | Median 4BR | Est. bill | Rank by bill |
|---|---|---|---|---|---|
| Newton | $9.69 | 29 | $1.9M | ≈$18,400 | 209 |
| Wellesley | $10.17 | 42 | $2.25M | ≈$22,900 | 216 |
| Brookline | $10.24 | 44 | $2.05M | ≈$21,000 | 213 |
| Weston | $10.88 | 61 | $2.9M | ≈$31,600 | 223 |
| Manchester-by-the-Sea | $8.70 | 19 | $1.5M | ≈$13,000 | 179 |
| Cambridge | $6.67 | 6 | $1.7M | ≈$11,300 | 162 |
| Needham | $10.83 | 59 | $1.85M | ≈$20,000 | 211 |
| Hingham | $10.47 | 50 | $1.65M | ≈$17,300 | 201 |
| Marblehead | $8.56 | 15 | $1.35M | ≈$11,600 | 165 |
| Duxbury | $9.96 | 36 | $1.4M | ≈$13,900 | 184 |
Newton is the cleanest example. 29th-lowest rate in the state — the sort of number that ends up in a “low tax towns” listicle — and the 209th-lowest bill, which is to say nearly the highest. It moves 180 places when you ask the question properly.
And the towns it libels
The mirror image: rates that look punitive attached to bills that are among the smallest in Massachusetts.
| Town | Rate | Rank by rate | Median 4BR | Est. bill | Rank by bill |
|---|---|---|---|---|---|
| North Adams | $15.97 | 207 | $300k | ≈$4,800 | 10 |
| Holyoke | $17.43 | 216 | $340k | ≈$5,900 | 32 |
| Pittsfield | $17.50 | 218 | $360k | ≈$6,300 | 43 |
| Springfield | $15.46 | 201 | $375k | ≈$5,800 | 31 |
| Southbridge | $14.89 | 192 | $375k | ≈$5,600 | 26 |
| Ware | $14.49 | 187 | $375k | ≈$5,400 | 23 |
| Palmer | $16.66 | 213 | $400k | ≈$6,700 | 54 |
| Ludlow | $16.01 | 209 | $420k | ≈$6,700 | 56 |
| Chicopee | $15.24 | 197 | $420k | ≈$6,400 | 46 |
| Greenfield | $18.64 | 221 | $400k | ≈$7,500 | 71 |
North Adams carries one of the highest rates in Massachusetts at $15.97, and one of the lowest bills in Massachusetts at ≈$4,800 — 197 places in the other direction. A family that ruled it out on the rate ruled out one of the cheapest tax bills in the state.
Why the rate is high where houses are cheap
A town has to raise roughly what its schools, roads and pensions cost, and it raises that from the value of everything standing in it. Where the property base is small, the rate has to be large to collect the same money. Where the base is enormous, a small rate collects plenty. Proposition 2½ caps how fast the total levy can grow, not the rate — so when values rise, rates typically fall while bills keep climbing.
Which is the thing worth internalising: a falling tax rate is not a tax cut. It is usually what a rising assessment looks like from the other side.
What to do with this
- Never compare towns on rate. Compare the bill on the house you would actually buy. Two towns at $10 and $15 per $1,000 tell you nothing until you know what the house costs in each.
- The bill is not the whole cost either. The lowest bill in the state belongs to Dennis, at roughly ≈$3,000 a year — on a $700k house in a middle-tier district. A small tax bill can be the cheapest part of an expensive decision. Tax is one of four things worth weighing, which is why our finder weighs it against schools, price and commute rather than on its own.
- Watch the assessment, not the rate. When your town announces a lower rate, your bill can still rise. The levy is the thing that grew.
Method, and what is soft about it
Rates are FY2026 residential rates for the 223 municipalities we cover, from the state Division of Local Services’ Tax Rates by Class. The bill applies each town’s rate to its own median 4-bedroom estimate.
The soft part: our 4BR figure is a market estimate calibrated to the Zillow Home Value Index and Redfin, not an assessed value — and assessments lag the market, usually by a year or more. So no number here is what a specific owner pays, and you should not treat it as one. The finding does not depend on that precision: it is about the rank ordering, and a uniform assessment lag moves every town together. The gap between Newton at rank 29 by rate and rank 209 by bill is far too large for an assessment lag to explain.
Residential exemptions, which some cities offer owner-occupiers, are not modeled and would lower the bill in a handful of places — Boston and Cambridge among them. That makes the point stronger, not weaker: those are low-rate cities already.
Full table of all 223 municipalities: Massachusetts property tax rates by town. Data last reviewed . Sources and caveats in the methodology. Estimates for comparison, not tax advice.