Your town’s tax rate tells you almost nothing about what it spends
Real FY2025 budgets for 221 towns. Municipal spending per resident runs from about $2,000 to $8,600 — and how much a town spends has essentially no relationship to its tax rate (r = −0.06). It tracks property wealth instead. Chatham spends $8,344 a head at a $3.67 rate; Athol spends $2,124 at $12.67.
The property-tax rate is the one municipal-finance number everyone sees. It is printed on every listing, ranked in every “lowest taxes in Massachusetts” roundup, and read as a verdict on the town: a high rate means a heavily taxed, big-spending place; a low rate means a lean one. We now hold every town’s real budget, so that reading can be checked rather than assumed. It does not survive.
Across the 221 towns with a published FY2025 budget, how much a town spends per resident has almost no relationship to its tax rate — a correlation of -0.06, which is to say none. What it tracks instead is property wealth.
What towns actually spend
Municipal spending per resident runs from about $2,040 in Dudley to $8,635 in Weston — better than a four-fold spread, around a median of $4,579. That is each town’s General Fund total expenditures divided by its residents: the appropriated operating budget — schools, public safety, public works, debt service and the rest — that a town meeting or city council actually votes.
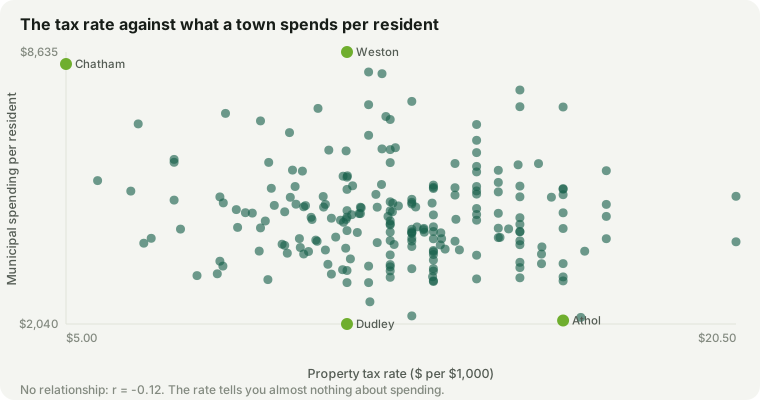
The chart is a formless cloud, and that is the finding. Line the towns up by tax rate and split them into quarters: the quarter with the lowest rates (median $9.70) spends a median of $4,728 per resident. The quarter with the highest rates (median $15.10, more than half as much again) spends $4,684 — slightly less. Paying a 50-percent-higher rate buys the average resident no more town.
Why the rate misleads
The arithmetic is simple once you write it down. A town’s spending is funded by its tax levy, and the levy is the rate times the value of everything in town. The rate is only the price of a thousand dollars of property; the levy depends just as much on how many thousands there are. A low rate on very expensive property raises an enormous amount; a high rate on cheap property raises little.
Chatham is the clean example: it sets one of the state’s lowest rates, $3.67, and still spends $8,344 a head — near the very top — because its property is worth a fortune. Athol, at $12.67, more than three times the rate, spends $2,124. The town with the far higher rate spends far less, because the rate was never the point.
Turn the same spending against house prices instead of the rate and the cloud snaps into a line.
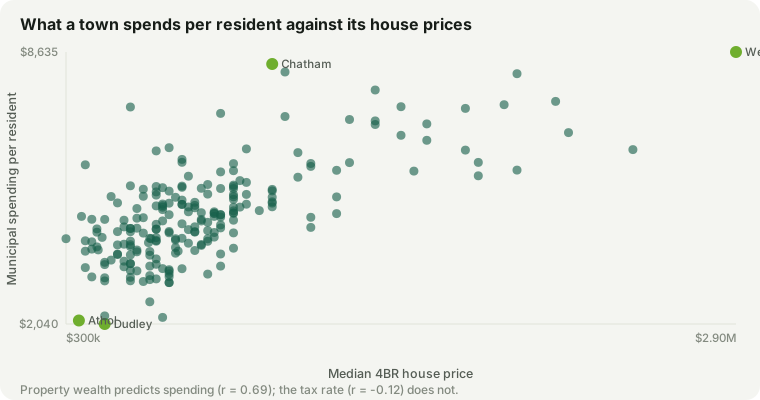
Spending per resident correlates 0.69 with house prices — a real, strong relationship where the rate had none. The expensive towns spend more per person not because they tax themselves harder but because a modest rate on a $2-million tax base is a large budget.
| Highest spending per resident | Per resident | Tax rate |
|---|---|---|
| Weston | $8,635 | $10.88 |
| Chatham | $8,344 | $3.67 |
| Bedford | $8,149 | $12.49 |
| Lexington | $8,108 | $12.31 |
| Sherborn | $7,714 | $15.66 |
| Concord | $7,437 | $13.05 |
The biggest spenders are not the highest-rate towns — most are middling or low. A few are Cape & Islands resort towns; see the note below.
What this is and isn’t
This is about a town’s total spending, not your tax bill. The two mislead in the same direction for the same reason — we showed separately that a low rate routinely comes with a higher bill — but the figure here is the whole municipal budget per resident, not what one household pays.
Three honest caveats. The spending figures are FY2025 General Fund total expenditures from each town’s DLS Schedule A filing, self-supporting enterprise funds excluded; two towns (Holyoke and Hudson) have not filed one recently and are left out. The 4BR price is our market estimate, not an appraisal. And 10 Cape & Islands resort towns have a small year-round population serving a large summer one, which lifts their per-resident number; drop them and the rate correlation is 0.02, still nothing, while wealth holds at 0.71. Finally, this is a description of where the money is, not a claim that any town spends too much or too little — that is a judgement the numbers can’t make.
Municipal budgets: FY2025 DLS Schedule A, General Fund total expenditures. Tax rates and prices as shown on each town page. Site data updated September 17, 2026. Every town’s figure is on its own town page.