Towns with more subsidized housing did not see slower price growth
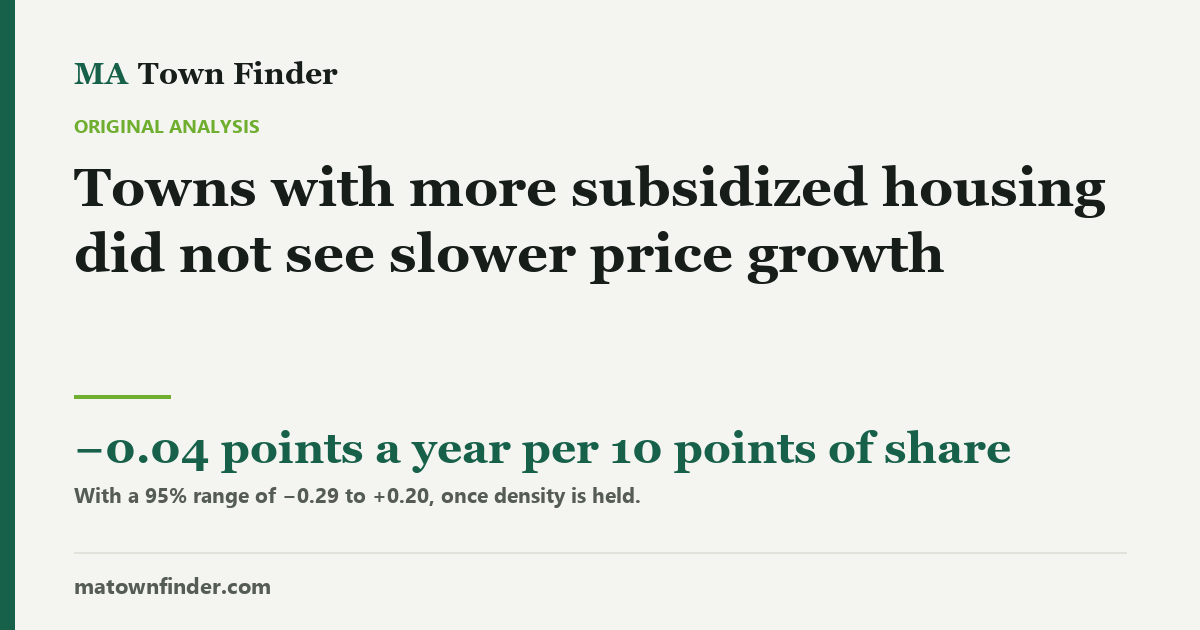
The argument at every 40B hearing is that subsidized housing drags down everyone else’s prices. Across 223 Massachusetts towns and ten years, towns over the 10% line grew 5.87% a year against 6.20% — but they started dearer and denser. Hold those fixed and the gap vanishes: a town ten points higher on the state’s inventory grew 0.04 points a year slower, with a 95% range from 0.29 slower to 0.20 faster. Town-level data cannot see the house next door, and the piece says so first.
At almost every Chapter 40B hearing, and at most of the votes on the state’s new transit-area zoning, someone makes the same argument: subsidized housing brings down what everyone else’s house is worth. This site already publishes every town’s share of homes on the state’s Subsidized Housing Inventory and ten years of prices for the same towns. So it can test the version of that claim that town-level numbers can test: did towns with a larger share see slower price growth?
First, what this cannot see
- The house next door. The claim is usually about the homes beside a new development, not a whole town. A town-wide average can hide a street-level effect in either direction.
- When the units arrived. The inventory share is the state’s September 2025 count. A town that built a lot over the decade looks the same here as one that always had it.
- Which way it runs. Developers file 40B projects where prices are high enough to carry them, so prices can shape the inventory as well as the other way round.
With those limits, here is what the numbers say.
The raw gap is real, and small
Towns at or over the 10% line grew a median 5.87% a year from 2016 to 2026; towns under it grew 6.20%. Across all 223 towns the share and the growth correlate at r = −0.16. If you stopped there, you would say subsidized housing slowed things down a little.
But the towns over the line are different in two other ways that matter. They started dearer — a median $423k in 2016 against $351k — and dear towns grew more slowly for reasons that have nothing to do with housing policy. And they are denser — 1,300 people per square mile against 810 — and density turned into a drag on growth after 2020.
Hold those fixed and it disappears
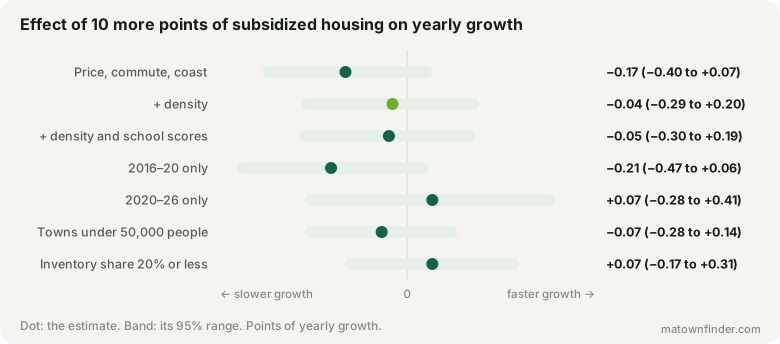
Hold the starting price, the drive to Boston and the coast, and a town ten points higher on the inventory grew −0.17 points a year (t = −1.4) — already too small to distinguish from nothing. Add density and it is −0.04(t = −0.4). Add school scores as well and nothing moves: −0.05.
What a null is worth
“No effect we can see” is not “no effect”, so the useful number is the range. For a town ten points higher on the inventory — roughly the gap between the state’s 10th and 90th percentile towns — the 95% range runs from −0.29 to +0.20 points of growth a year. That rules out the large effect the argument usually implies. It cannot rule out a small one in either direction.
- 2016–20 only (223 towns): −0.21, range −0.47 to +0.06.
- 2020–26 only (223 towns): +0.07, range −0.28 to +0.41.
- Towns under 50,000 people (197 towns): −0.07, range −0.28 to +0.14.
- Inventory share 20% or less (222 towns): +0.07, range −0.17 to +0.31.
Price levels say the same. At the same commute, coast, school scores and density, a town ten points higher on the inventory is +0.5% in price, with a range of −5.6% to +7.0% — no detectable discount.
Matched on price
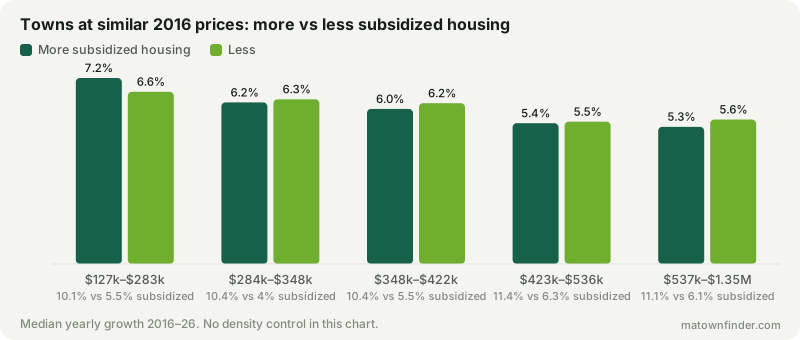
Within groups of towns that started at similar prices, the half with more subsidized housing grew a little more slowly in four of the five — by between 0.06 and 0.28 points a year. That is the residue the density control then explains: the two measures overlap (r = 0.35).
How to use this
- Treat the town-wide claim with scepticism. Over a decade, across 223 towns, a larger subsidized share did not come with measurably slower price growth.
- Ask the street-level question separately. If what worries you is one building next to one house, town figures cannot settle it either way.
- Know where your town stands. Whether a developer can use 40B there at all depends on the 10% line.
How this was measured
The inventory share is the state’s Subsidized Housing Inventory percentage as of September 2025, as on each town page. Growth is the compound annual change in the Zillow Home Value Index, all homes, from mid-2016 to mid-2026. Each model is least squares on growth with the inventory share, the log 2016 price, the drive to Boston and a coastal indicator, then log density and the MCAS share meeting expectations as stated; effects are per ten points of share, with 95% ranges from the standard error. The price-level model uses Zillow’s observed three-bedroom value. Boston’s neighborhoods share the city’s figures and count once. See the methodology, or download the tables. Figures as of October 9, 2026.