Your town is, more than anything else, a school system
Break 219 Massachusetts town budgets into their ten categories and one line wins almost everywhere: education is the single biggest expense in 217 of them, about half of all spending, four times what a town spends on police and fire. The share runs from 20% to 67% — and what moves it is the kind of town, not how rich it is.
A town budget arrives as one big number, or as a warrant with a hundred line items nobody reads to the end. Neither tells you what a town government mostly is. Split every dollar into the ten categories the state collects, and the answer is the same in almost every town in Massachusetts: it is a school system with some other services attached.
Across the 219 towns with a published FY2025 budget, education is the single largest expense in 217 of them — 99%. It is the biggest line in the rich suburbs and the struggling cities alike. In the only two exceptions, Athol and Chatham, the thing that beats it is public safety, and only just.
Where the money goes
Add every town’s spending together and education is 44% of the whole — more than the next three categories combined. Nothing else is close. The second-biggest line is not police, not roads: it is fixed costs at 19% — pensions, health insurance and the premiums a town pays whether or not it opens a single new program this year.
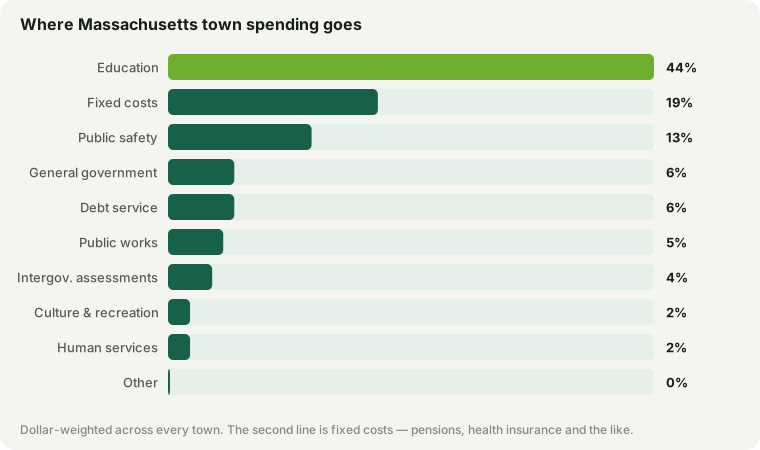
Put schools next to the service most people picture when they think of town government — police and fire — and it is roughly 4× the size. The typical town spends about 49% of its budget on schools and 12% on public safety.
From a fifth to two-thirds
The average hides a wide spread. The school share runs from 20% to 67% of the budget, and which end a town lands on says less about its schools than about everything else it has to pay for.
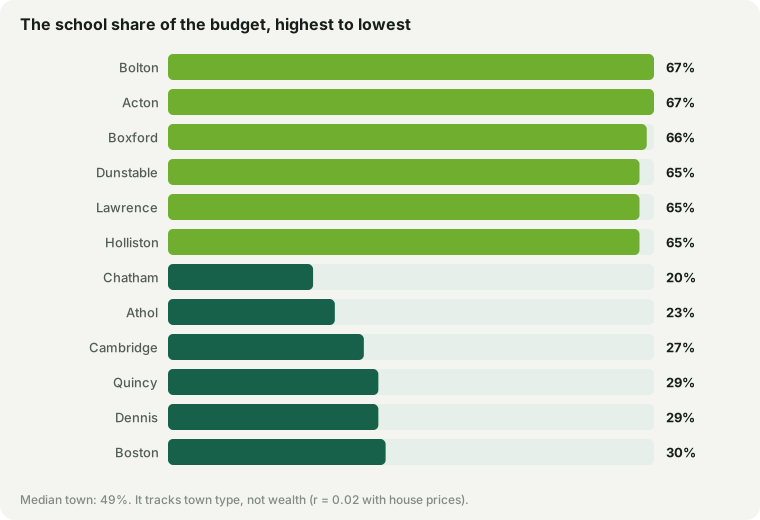
| Biggest school share | Schools |
|---|---|
| Bolton | 67% |
| Acton | 67% |
| Boxford | 66% |
| Dunstable | 65% |
| Lawrence | 65% |
| Holliston | 65% |
| Smallest school share | Schools |
|---|---|
| Chatham | 20% |
| Athol | 23% |
| Cambridge | 27% |
| Quincy | 29% |
| Dennis | 29% |
| Boston | 30% |
The top of the list is bedroom suburbs — Bolton, Acton, Boxford. A commuter town with little commercial property, a small police force and no hospital or transit to run has few other places for the money to go, so two of every three dollars land on the schools. The bottom is the big cities — Boston, Cambridge, Quincy — and the Cape resort towns. A city funds a large police and fire service, public works, human services and the pension and health bill for all of it; the beach towns run tourist infrastructure for a summer population many times their winter one, on comparatively few schoolchildren; and an older mill town like Athol carries heavy fixed and public-safety costs against a modest school assessment. In Chatham, schools are barely 20% of the budget.
Notice what does not move the share: money. The correlation between a town’s school share and its house prices is 0.02 — nothing. Expensive towns do not devote a bigger slice of their budget to schools than cheap ones; the tilt that exists runs with size, not wealth (bigger towns a little lower, at -0.31). A rich suburb and a modest one can both be two-thirds schools.
What this is and isn’t
Two honest notes. This is the share of a town’s spending, not a measure of school quality or effort — a big share can reflect a town with little else to fund, and spending is not the same as results. And for the many towns in regional school districts, the education line is the town’s assessment to its district, which is exactly the sum it appropriates — so the comparison holds across town types, but the dollars serve a district, not one town’s children alone.
Categories are FY2025 General Fund expenditures from each town’s DLS Schedule A, self-supporting enterprise funds excluded; a few towns that had not filed FY2025 are omitted. Site data updated September 17, 2026. Each town’s budget is on its own town page.