A new school costs about 11% more every year
Fifty-seven school building projects across 80 Massachusetts towns, from Medway’s $22.1M middle school to Revere’s $493M high school. Projects finishing in 2009–15 ran a median $66M; those due by 2030 are budgeted at $177.5M. High schools cost 2.3 times an elementary and the recent end of the list carries more of them — but put that in the model and the year still costs 11.1% (t = 10.5), and it holds among finished buildings alone. You cannot see any of it in the tax rate.
Every town page on this site carries a line about the town’s most recent major school building project, taken from the Massachusetts School Building Authority’s project list. They have never been read together. Read together, they are the only price series here that is not about houses — and the steepest one this site holds.
57 distinct projects across 80 towns, from $22.1M to $493M. The middle one is $94.8M.
The same building costs more every year
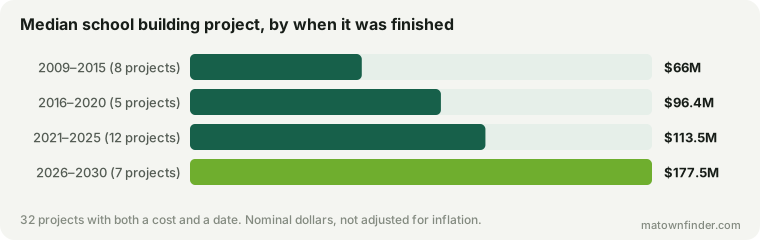
Projects finishing in 2009–2015 came in at a median of $66M. Those due in 2026–2030 are budgeted at $177.5M. Across the 32 projects with both a cost and a date, the two rise together at r = 0.69.
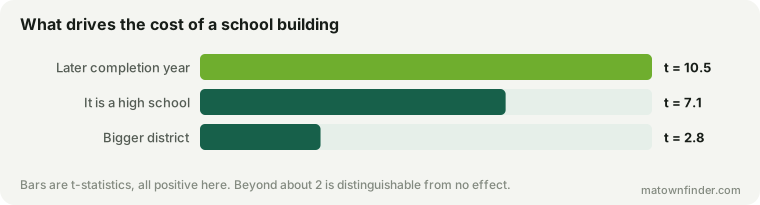
The obvious objection is that this is a change in what is being built rather than a change in price. It is not. A high school costs about 2.3 times what an elementary school costs ($169.5M against $89.7M), and the recent end of the list does carry more of them — so put a high-school term in the model and see what happens to the year. The answer is nothing: cost rises 11.1% a year with the term in (t = 10.5), and by the same 11.1% without it.
Two more ways to break it
Add the size of the district doing the building and the rate softens to 9.7% a year but holds firmly (t = 9.1). And because the recent end of the list is thick with buildings that do not exist yet — budgets are easier to write than buildings — drop every active and planned project and keep only the 25 that are finished, with a completion date. The rate is 11.1% a year (t = 8.6). It is not an artefact of optimism.
What that buys, and where
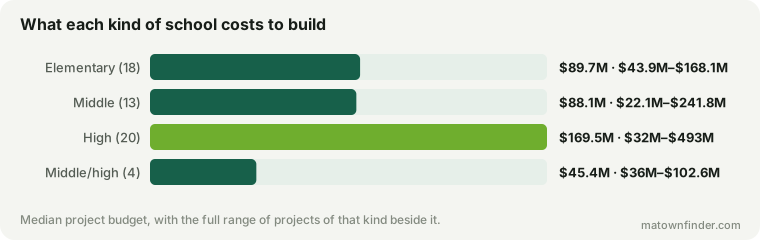
The cheapest projects here are Medway ($22.1M), Sturbridge ($32M), Southwick ($36M). The dearest are Revere ($493M), Salem ($447.4M), Lowell ($343.4M), Worcester ($314M) — all high schools, all either under construction or newly finished.
Projects still on the drawing board are budgeted well above the ones already standing: the median completed building here cost $88.1M and the median active one is $159.9M.
Two towns, one building
Four of these projects belong to more than one town, because regional districts build once and the bill is shared: Hamilton and Wenham ($142.3M), Dennis and Yarmouth ($111.3M), Carlisle and Concord ($93M), Chatham and Harwich ($59.5M). Counting by town rather than by building would count each of them twice, which is worth saying because it is the easiest mistake to make with this data and it inflates every total by design.
A further two towns — Medfield and Brockton — are weighing a range rather than a budget, and are left out of every figure above. The widest of them reads: “A replacement or major rebuild of Brockton High School was in feasibility planning in 2026, with public planning estimates ranging from roughly $350 million to $700 million; no final approved project budget was set in the review.” That is not a number yet; it is a decision.
You cannot see it in the tax bill
The natural next question is whether a town that has just built a $493M school shows it in what it collects. In this data, no. Project size against the debt share of the town budget: r = 0.00. Against the tax rate: −0.19. Against the price of a house: −0.05.
That is a real null and not a reassuring one. The MSBA reimburses a large share of an approved project, debt is issued over decades, and the rate is not what anyone pays anyway. A town’s rate reflects its property values far more than its borrowing. The cost is real; it is simply not legible in the three numbers a buyer is most likely to check.
What this is not
- These are nominal dollars. No deflator is applied, and a good part of 11.1% a year is ordinary inflation. Construction costs generally rose sharply over this period. The figure is what a town had to appropriate, not a real-terms index.
- It is one project per town. The most notable recent one, not a census of Massachusetts school construction. It describes the buildings this site records.
- A budget is not a final cost. Roughly a third of these are buildings that do not exist yet. That is exactly why the finished-only check above matters, and it is the check to trust.
How to use this
- Ask what stage the project is at. A town with a feasibility study has not decided anything. A town with an approved budget has committed for a generation.
- Do not read the tax rate for it. It is not there. If you want to know what a town has committed to, read what its budget is already promised to, which is the line that actually moves.
- A new building is not a better district. Nothing here measures teaching, and this site has shown that what a district spends does not rank it.
How this was measured
Projects are read from the school building note on each town page, imported from the MSBA project list. Only the first sentence of each note is parsed, because several describe a newer project and then an older one and reading the whole string pairs one building’s budget with another’s date. Amounts are stated total project budgets or costs; an MSBA grant is the state’s share and is never treated as the project size, and a published range is excluded rather than resolved to a midpoint. Projects are deduplicated on amount and type, so a regional school shared by two towns counts once. The model is least squares on log cost with the completion year and an indicator for high schools. Boston’s neighborhoods share the city’s row and count once. See the methodology, or download the tables. Figures as of October 9, 2026.