After schools, the biggest thing your town buys isn’t a service
Half the budget is schools. The next-biggest slice — 24% statewide — buys no service at all: it’s employee and retiree benefits, insurance, and debt. In 190 of 219 towns those obligations outweigh police and fire combined, and it tracks a town’s size and age, not its wealth.
We showed last time that a Massachusetts town is, more than anything else, a school system — education is about half of everything it spends. That leaves the other half, and the natural assumption is that it buys the services a town is for: police and fire, roads, parks, a library, a town hall. Most of it doesn’t.
After schools, the biggest claim on a town budget is not a service at all. It is obligations — the benefits it owes its employees and retirees, the insurance it must carry, and the debt it took on for past projects. Across the 219 towns with a published FY2025 budget, those lines take 24% of all spending. Every other service combined gets the 31% that is left.
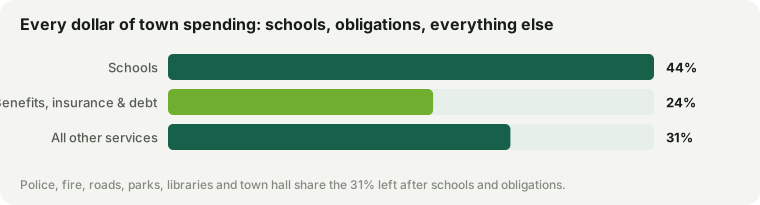
Read that middle bar slowly. Benefits, insurance and debt service — at 24% — are a bigger share of the average town budget than police, fire, public works, parks, libraries and general government put together, which share the remaining 31%. The single largest piece of it is employee and retiree health insurance and the annual pension contribution; debt service adds the rest.
More than police and fire
The cleanest way to feel the size of it: compare it to the service most people picture first. In 190 of 219 towns — 87% — the town spends more on benefits, insurance and debt than it spends on public safety, its police and fire departments combined. The bill for people no longer working, and buildings already built, outweighs the badge and the engine almost everywhere.
From 8% to 39%
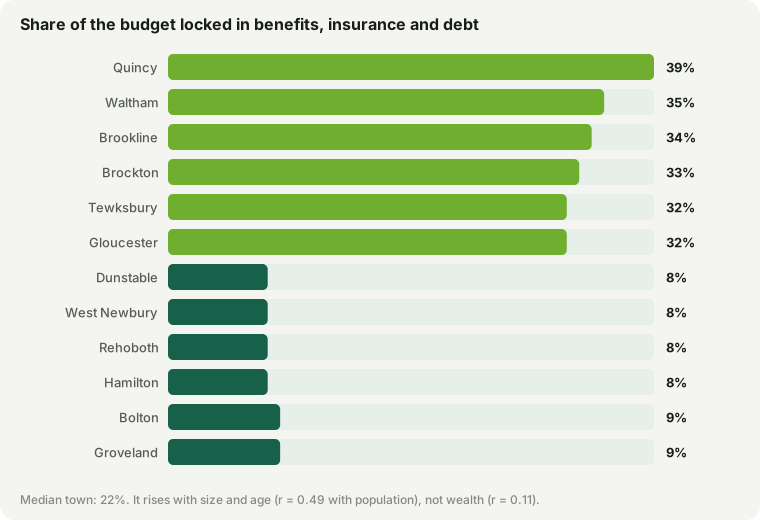
How locked-in a budget is varies enormously — the obligation share runs from 8% to 39% — and it is not a story about rich towns versus poor ones.
| Most locked in | Obligations |
|---|---|
| Quincy | 39% |
| Waltham | 35% |
| Brookline | 34% |
| Brockton | 33% |
| Tewksbury | 32% |
| Gloucester | 32% |
| Least locked in | Obligations |
|---|---|
| Dunstable | 8% |
| West Newbury | 8% |
| Rehoboth | 8% |
| Hamilton | 8% |
| Bolton | 9% |
| Groveland | 9% |
The top of the list is the old, heavily-staffed cities — Quincy, Waltham, Brookline, Brockton. A place that has employed a large workforce for a century carries a deep bench of retirees and a big health-insurance bill, and has usually borrowed to match. The bottom is small, newer residential towns — Dunstable, West Newbury, Rehoboth — with few career employees and little debt. The share rises with a town’s size and age (a correlation of 0.49 with population), not its wealth: the list puts Brookline, one of the state’s most expensive towns, at 34%, right beside Brockton, one of its least, at 33%. House price barely moves it (0.11).
What this is and isn’t
“Obligations” is not a synonym for waste. Health insurance covers the people who deliver today’s services, and the debt built the schools and roads a town uses now. The point is narrower, and it is about flexibility: this is the part of the budget a town cannot change by cutting a program or trimming a department. Pensions are legally protected, debt service is contractually owed, and insurance is not optional. When a quarter of the budget is spoken for before the town opens for business, the real argument over the next override or budget cut is happening inside the 31% that is left.
Figures are FY2025 General Fund fixed costs and debt service from each town’s DLS Schedule A, self-supporting enterprise funds excluded; a few towns that had not filed FY2025 are omitted. Site data updated September 17, 2026. Each town’s budget is on its own town page.