The district spending the most per pupil is not the best one
Across 203 Massachusetts districts, per-pupil spending tracks house prices far more closely than it tracks results. The lowest-scoring quarter of districts spends the most. Hopkinton reaches the 99th percentile on $18,315; Springfield reaches the 6th on $25,418.
Per-pupil spending is one of the few school figures a town publishes plainly, so it gets used as a proxy for how good the schools are. It is a reasonable-sounding instinct: more money, more teachers, smaller classes, better outcomes.
Set the figure against results for all 203 Massachusetts districts we cover and the instinct does not survive. Hopkinton reaches the 99th percentile spending $18,315 a pupil. Springfield reaches the 6th spending $25,418 — nearly $7,103 more, for a result 93 percentile points lower.
Spending barely moves with results
Across the 203 districts, the correlation between per-pupil spending and the district’s MCAS percentile is 0.11. The correlation with local house prices is 0.46. Spending tracks the town far better than it tracks the schools.
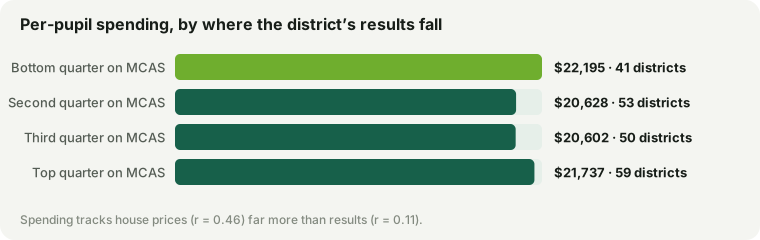
| District results | Districts | Median spend per pupil |
|---|---|---|
| Bottom quarter on MCAS | 41 | $22,195 |
| Second quarter on MCAS | 53 | $20,628 |
| Third quarter on MCAS | 50 | $20,602 |
| Top quarter on MCAS | 59 | $21,737 |
Read that table twice. The districts in the bottom quarter on results spend a median of $22,195 — more than the top quarter’s $21,737. The line is close to flat, and where it tilts, it tilts the wrong way for anyone using the figure as a ranking.
Why the highest spenders are at both ends
The reason is visible in the list of biggest spenders, which is not a list of the best districts or the worst. It is both at once.
| District | Per pupil | MCAS percentile |
|---|---|---|
| Cambridge | $39,212 | 79th |
| Boston | $33,854 | 22nd |
| Hull | $31,820 | 63rd |
| Weston | $31,170 | 99th |
| Concord-Carlisle | $30,708 | 95th |
| Berkshire Hills | $30,479 | 46th |
| Amherst | $30,024 | 69th |
| Wellesley | $29,869 | 98th |
| Lincoln-Sudbury | $28,504 | 97th |
| Somerville | $28,406 | 37th |
| Lexington | $27,831 | 99th |
| Brookline | $27,765 | 93rd |
Weston, Wellesley and Lexington are up there because they are wealthy towns that vote for school budgets. Boston and Somerville are up there for the opposite reason: Massachusetts deliberately directs state aid towards districts with the greatest need, and need is expensive. Higher shares of pupils learning English, of pupils with disabilities, of pupils in poverty — every one of those costs money to serve properly, and the funding formula is built to send it.
This is not evidence that money does not work. It is evidence that spending is set by need and wealth, not by results — so the number cannot be read backwards as a measure of quality. Whether a given dollar improves a given school is a real question, and it is not one this data can answer.
The two ends of the table
Ranked by percentile points per thousand dollars spent — a crude ratio that flatters small, low-need districts, and shown here only to put the extremes side by side.
| Most result per dollar | MCAS | Per pupil |
|---|---|---|
| Hopkinton | 99th | $18,315 |
| Melrose | 85th | $16,976 |
| Winchester | 97th | $19,932 |
| Westford | 90th | $19,262 |
| Medfield | 96th | $20,886 |
| Arlington | 93rd | $20,549 |
| Shrewsbury | 86th | $19,040 |
| Longmeadow | 85th | $18,939 |
| Least result per dollar | MCAS | Per pupil |
|---|---|---|
| Holyoke | 1st | $24,807 |
| Southbridge | 1st | $23,768 |
| Lynn | 2nd | $22,388 |
| Chelsea | 5th | $24,407 |
| Fall River | 5th | $23,626 |
| Lawrence | 5th | $23,486 |
| Springfield | 6th | $25,418 |
| Webster | 6th | $22,940 |
The second table is a list of the state’s Gateway Cities, and it should be read as a description of what they are asked to do rather than of how well they do it. They serve the pupils with the furthest to travel, they are funded accordingly, and a single test percentile does not capture the distance covered. Melrose at $16,976 and the 85th percentile is a genuinely lean suburban district; it is not doing the same job as Boston at $33,854.
What the figure is actually good for
Not ranking. But it is not useless either — it just answers a different question.
- Comparing like with like. Between two similar suburbs at similar prices, a large spending gap is worth asking about. Between a wealthy suburb and a city, it tells you what you already knew about the towns.
- Reading the tax bill. Schools are the largest line in most municipal budgets, so per-pupil spending is part of why a town’s rate is what it is. That connection is real, and it is on each town’s page here.
- Spotting a district under strain. Unusually low spending in a town with rising enrolment is a fair thing to raise at a school committee meeting.
What it will not do is tell you which of two districts is better. For that the assessment percentile, the growth figure and the district’s own results are the honest measures — and even they come with the caveat this site keeps returning to: a district average is an average of a lot of schools.
How this was measured
Per-pupil spending and pupil counts from each district’s published municipal figures, joined to the district’s statewide MCAS achievement percentile. Rows are districts, not towns: a regional district serves several towns and reports one figure, so counting it per town would weight it by how many towns it covers. That gives 203 districts from 223 municipalities, 17 of them regional. Correlations are Pearson’s r. Spending runs from $15,662 to $39,212 a pupil, median $21,257.
The mechanism described above — that aid follows need — is the well-established design of Massachusetts school funding, not something demonstrated by this data. This site does not use demographic measures in its rankings or search, so no attempt is made here to quantify need district by district; the point stands on the spending and results alone. Figures as of September 11, 2026. Every town’s per-pupil figure is on its page in the town finder.