The state already grades every district. It costs $950,000 to buy into the top of it.
Families compare districts with Niche grades and US News rankings, all of them commercial and all scored differently. Massachusetts issues its own determination for every district in one line of plain English, free, and it lines up with house prices almost perfectly — $450k at the bottom rung, $1.5M at the top. Of the 25 towns the state says are meeting or exceeding their targets, not one is priced below the statewide median.
Everyone shopping for a school district ends up on the same three or four sites: a letter grade from one, a number out of ten from another, a national ranking from a third. All commercial, all scored differently, and not always in agreement.
Massachusetts publishes its own determination for every district, once a year, in a single line of plain English. It is free, it is official, and in the course of building this site I have never once seen it quoted in a listing or a relocation guide.
What it says, and what it costs
Every district lands on one of five rungs, from “in need of broad or targeted support” at the bottom to “meeting or exceeding targets” at the top. Sorted by the median house price of the towns on each rung, they come out in exact order.
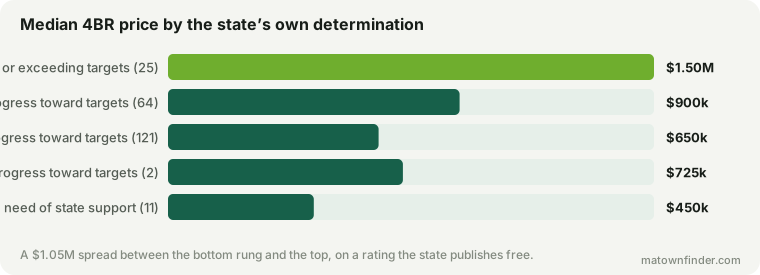
$450k at the bottom, $1.5M at the top — a spread of $1.05M tracking a rating that costs nothing to look up. The middle rungs fall in line too: $900k and $650k for substantial and moderate progress respectively.
There is no cheap way onto the top rung
25 of the 223 towns here are on the top rung. The statewide median 4BR is $750k. The number of those 25 towns priced below that median is 0.
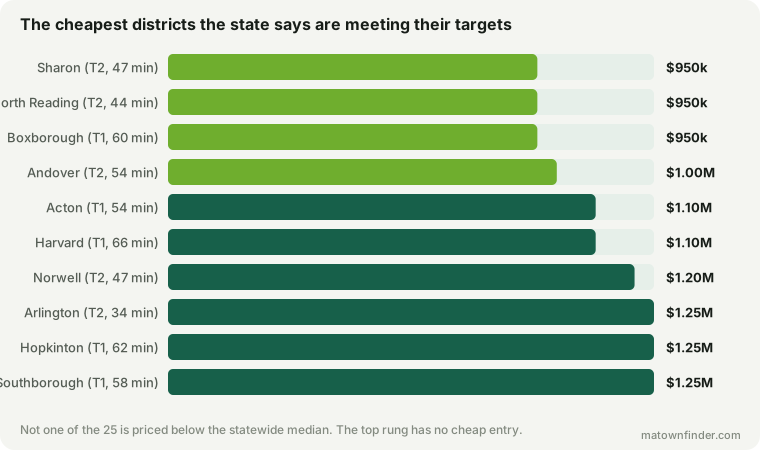
The cheapest entry is Sharon at $950k, a Tier 2 district 47 minutes out. That is the floor: $200k above the median house in Massachusetts, before you have considered whether you want to live there.
Which is the same wall this site keeps running into from different directions — a $750,000 budget reaches no Tier 1 district, and a household on $150,000 reaches none of them either. Here it is again in the state’s own words rather than ours.
What the rating is actually measuring
This is where it gets more useful than a grade, and where it is most often misread. Accountability is a measure of progress against a district’s own targets, not of how it stands against everyone else. A district can score well and sit on a middling rung because it has stopped moving.
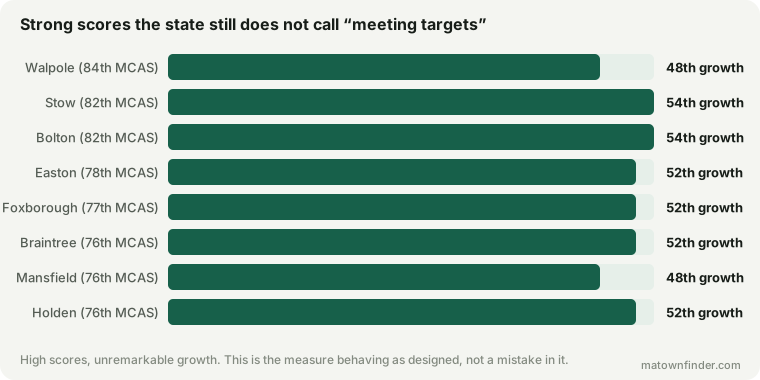
Walpole (84th percentile), Stow (82nd percentile), Bolton (82nd percentile) and 5 others score in the top quartile on MCAS and are still only making “moderate progress” by the state’s reckoning. Their growth percentiles sit around the middle. Nothing is broken in those districts; they are simply not improving, and the state is saying so.
That is the same distinction as achievement against growth, which this site has argued is the more honest pair of numbers. The accountability determination is closer to the growth half — which is exactly why it is worth reading alongside a score rather than instead of one.
Expensive districts the state is not impressed by
Run it the other way. Of the towns in the top quarter by price — above $950k — 8 have districts the state puts no higher than “moderate progress”:
| Town | 4BR | Tier | MCAS | Growth |
|---|---|---|---|---|
| Somerville | $1.25M | T3 | 37th | 51st |
| Boston | $1.15M | T4 | 22nd | 50th |
| Chatham | $1.1M | T3 | 56th | 50th |
| Swampscott | $1.05M | T2 | 57th | 45th |
| Falmouth | $975k | T3 | 53rd | 47th |
| Stow | $950k | T2 | 82nd | 54th |
| Bolton | $950k | T2 | 82nd | 54th |
| West Newbury | $950k | T3 | 64th | 48th |
Two different stories in one table. Somerville and Boston are expensive for reasons that have nothing to do with their districts — they are the urban core, and proximity is doing the work. Chatham and Falmouth are expensive because of the water. Stow and Bolton are the interesting pair: strong scores, shared district, and a determination that says they have plateaued.
How to use this
- Read it alongside a score, not instead of one. The rung tells you the direction of travel; MCAS tells you where the district currently stands. A buyer needs both.
- Do not treat a middling rung as a warning. Half the districts in the state are on it, including some of the highest-scoring ones.
- It is free and it is official. Every town page here carries its determination, and DESE publishes the full profile for any district in the state.
How this was measured
Accountability determinations are DESE’s own, as carried in this site’s school data for the 223 municipalities it covers, matched to each town’s resident-serving district. The two “in need of support” determinations are reported together as one rung: both mean the state has intervened, and separating two towns from nine would be false precision.
Prices are this site’s modelled median 4BR, calibrated to the Zillow Home Value Index and Redfin, and medians are taken across towns rather than weighted by size. A regional district shared by several towns carries one determination, so those towns each report it. School tiers are editorial and shown next to the state’s own figures throughout — see the methodology, or download the school table. Figures as of September 17, 2026.