The one public option before kindergarten is in the towns with the weakest schools
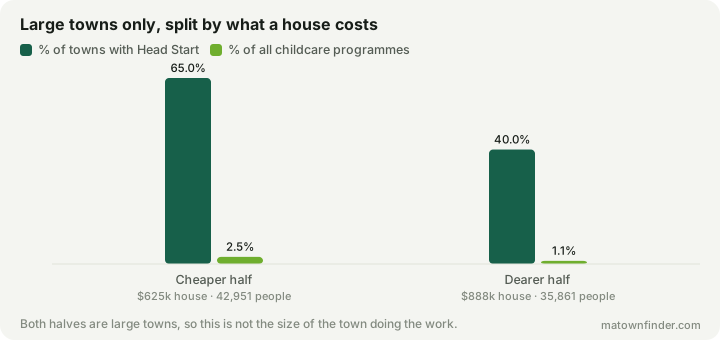
Head Start runs in 59 of the 222 Massachusetts towns here — 30 of the 46 Tier 4 towns, and 1 of the 23 in Tier 1. That is by design, because eligibility is set by income, but it is also a fact about the bill: buy into a top district and the years before kindergarten are a private market with no public option in them. The gradient is not just town size, either — among towns over 25,000 people, the cheaper half has Head Start in 26 of 40 against the dearer half’s 16 of 40.
Two pieces here have covered the years before school. One splits the market into centres and family homes; the other shows how little of it takes babies. Both are about what a family buys. This is about the one form nobody buys — Head Start, the federal preschool programme — and where in Massachusetts it is.
It runs in 59 of the 222 towns here, 149 programmes in all. Sorted by this site’s school tiers, the distribution is close to a straight line, and it runs the opposite way to almost every other school figure on this site.
Sixty-five percent of the bottom tier, four percent of the top
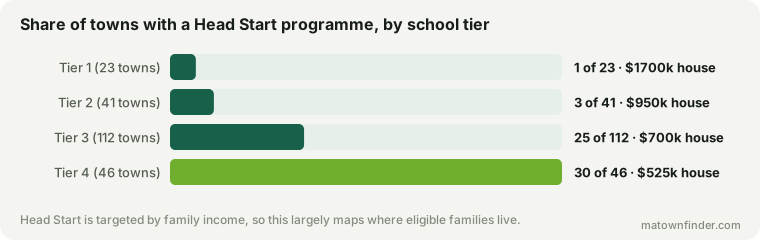
30 of the 46 Tier 4 towns have a Head Start programme. In Tier 1 it is 1 of 23, and that one is Lexington. Across the four tiers the share runs 4.3%, 7.3%, 22.3%, 65.2%, against median house prices of $1.7M, $950k, $700k, $525k.
Say the obvious thing first
Head Start is targeted by income. Federal eligibility runs to families at or near the poverty line, and programmes open where enough eligible children live. A map of Head Start is therefore partly a map of where low-income families are, and nobody should read the chart above as a programme that has overlooked the suburbs. It is doing exactly what it was built to do.
The finding worth having is not that the distribution is strange. It is what the distribution means for a family choosing a town — which is a question this site can answer and the programme’s own documentation does not.
The confound that nearly explained it away
Towns with Head Start are much bigger: a median population of 40,876 against 15,121, and 47 childcare programmes of all kinds against 14. Bigger towns have more of everything, and in Massachusetts bigger towns are cheaper. So the tier gradient could simply be the size gradient wearing a hat. Three tests say it is not.
- Model both together. Whether a town has Head Start, on price and population at once: population matters (t = 9.3) and price still matters beside it (t = −4.3).
- Cancel size entirely. Count Head Start as a share of the town’s own childcare programmes and population nearly drops out (t = 1.9) while price holds (t = −3.1).
- Match on size. Among the 80 towns over 25,000 people, the cheaper half has Head Start in 26 of 40 and the dearer half in 16 of 40 — at median populations of 42,951 and 35,861. As a share of programmes, 2.5% against 1.1%.
And in every population band, from the smallest towns to the largest, Tier 1 and 2 towns have exactly one Head Start town between them while Tier 3 and 4 towns climb steadily with size.
What it means if you are choosing a town
If you move to a top-tier district, the years before kindergarten are a private market with no public option in them. That is not a complaint about Head Start — a family buying a $1.7M house is not income-eligible for it — but it is a fact about the shape of the bill. The school premium those towns charge buys school-age education. It buys nothing at all for a three-year-old, and the infant care gap means the private market in those towns is thinnest exactly where it is the only market there is.
The mirror of that: the towns with a public option are the towns with the weakest school ratings and the cheapest houses. A family weighing those towns is weighing five years of available, subsidised early education against thirteen years of a lower-rated district — a trade-off nothing else on this site prices, and one most rankings do not know exists.
What this does not show
- Not capacity. This counts programmes, not places or waiting lists. A town with a programme may still have nothing available, and Head Start is oversubscribed in much of the state.
- Not eligibility. Presence in a town says nothing about whether a given family would qualify.
- Not public pre-K generally. Some districts run their own preschool programmes that are not Head Start and are not counted here.
How this was measured
Programme counts come from the state’s childcare licensing data as carried on each town page, with Head Start identified as its own programme type; tiers and house prices are this site’s. Towns with no licensed childcare of any kind are excluded, leaving 222. Models are least squares on whether a town has any Head Start programme, and on Head Start as a percentage of the town’s programmes, each against log house price and log population. Boston’s neighborhoods share the city’s figures and count once. See the methodology, or download the tables. Figures as of October 9, 2026.