Woburn, MA Tier 3
Tier 3 · solid schools · 10 miles from downtown Boston, about 36 minutes door-to-door at peak · 56% of households own their home.

marks the Massachusetts median of $750k for a 4BR, $8,800 in tax and 62 min to Boston. Prices and the tax bill are estimates, not appraisals.
About Woburn
Woburn is a middle-tier school district north of Boston, about 10 miles from downtown Boston as the crow flies and 36 minutes door-to-door at peak, and moderately priced by Massachusetts standards: roughly $825k for a 4BR house and $480k for a 2BR condo. The residential rate is $9.15 per $1,000, low for Massachusetts, but on a $825k house that is still about $7,500 a year. Commuter rail runs downtown in about 30 minutes, against a 36-minute peak drive. The district sits in the 31st percentile statewide on MCAS. Anderson Regional's express trains and I-93/95 access.
The good, the bad, the ugly
From the data$9.15 per $1,000 — 22nd-lowest tax rate of the 241 places we track.
Only 56% of households own — much of the town turns over.
Mid-tier schools in a state where the next town over often isn't — that gap is the whole local conversation.
Schools and child caresolid schools · 31st MCAS · 9 schools
Public elementary & middle schools
9 public schools in Woburn — 7 elementary and 2 middle
These are assigned by address, not chosen. A regional district’s schools appear on every member town’s page. Charters are public but allocated by lottery, and are listed separately below.
Before kindergarten
| Licensed programs | 63 |
| Licensed places, all ages | 2,343 |
| Places in centers | 2,055 |
| Places in family child care | 288 |
| Infant & toddler places in centers | 558 |
| Preschool places in centers | 915 |
| Head Start programs | 1 |
Licensed capacity is not availability. These are places programs may operate, not vacancies. The age split covers centers only — family programs report no breakdown, so 558 is a floor on infant care here, not a count of it.
MA Dept. of Early Education and Care, pulled 2026-08-02 · search current openings
Public School Rankings
| Publisher ranking | Result |
|---|---|
| Boston Magazine | #81 of 148 · Woburn Memorial High School |
| Official Massachusetts data (DESE) | Result |
|---|---|
| MCAS achievement | 31st percentile statewide |
| Student growth (SGP) | 45th percentile |
| 4-year graduation rate | 91.1% |
| DESE accountability | Moderate progress toward targets |
Each publisher ranks a different thing. A district, a locality, or one high school, each by its own method — shown separately, never blended.
MCAS percentile is the district’s statewide rank on % Meeting/Exceeding expectations, ELA + Math.
Look up Woburn on Niche · SchoolDigger · U.S. News · DESE district profiles
Available Private School Options
18 of the 104 private schools in Woburn and within 12 miles
Tuition is an estimated range by school type, not school-published pricing — a parochial school and an independent day school are priced very differently. Private schools sit no MCAS, so no figure here is a state measure.
How to read this list
Schools within 12 miles of Woburn, from the MA DESE 2025–26 non-public enrollment report plus the Niche ranking of Massachusetts private high schools. Tuition shown as an estimated range by school type, grades and region — not school-published pricing. A parochial school and an independent day school are priced very differently, so treat these as a starting point and confirm with the school. Niche ranks private high schools only, so an elementary school never carries a number; where one shows a letter instead, that is Niche’s own overall grade, which reaches schools no ranked list does. Neither is a state measure — private schools sit no MCAS and report no results to Massachusetts. That Niche extract is also partial, so a school showing neither was not judged and found wanting; it may simply not have been in it. Student numbers are the figure schools do report, from the same DESE return. Where a student-teacher ratio is shown it is students over full-time-equivalent teachers in the federal Private School Universe Survey, 2021–22, the most recent published — a rough guide to class size, not a class size, and not a ranking either. It is shown only where that survey and the state agree on how many pupils the school has, which is why many schools here have none. Accreditation comes from the AISNE member directory, which records whether a school holds AISNE or NEASC accreditation — the two split the work by age rather than compete, AISNE taking the elementary and middle schools and NEASC the secondary ones. It means an outside body has reviewed the school against published standards on a ten-year cycle. It is not a measure of results, and its absence is not a mark against a school: plenty are not members at all. That directory is also where the schools marked files no enrolment with the state come from. They are real schools that simply make no return to Massachusetts, so the state holds no size for them and this page can show none — and for those, the grade range is read off AISNE’s age bands rather than taken from the school, so treat it as approximate and confirm with the school.
The vibe of Woburn
What it takes to live here$825k 4BR · ≈$7,500 tax
| To buy | Median price (est.) |
|---|---|
| 4BR / 2BA detached house | $825k |
| 3BR / 2BA townhouse | $650k |
| 2BR condo | $480k |
| Property taxes (FY2026) | $9.15 per $1,000 (0.92%) |
These are modeled estimates, not listings. Each row opens the real Redfin market in ZIP 01801, and the two will not match.
| By bedroom count | Median value (Zillow) |
|---|---|
| 3BR home | $764k |
| 5+ BR home | $950k |
Not the same kind of number as the table above. These are Zillow’s observed medians for the middle third of the market at that bedroom count, as of July 2026; the prices above are this site’s estimates for one particular property. They are measuring different things and will not agree. Zillow publishes the bedroom split for houses and condos together, so a “3BR home” here blends both, where each estimate above prices one building type and says which. And 5+ BR means five bedrooms or more: Zillow’s buckets stop at five, so that figure carries the largest houses in Woburn and sits above what a plain five-bedroom median would be.
| To rent | Per month (est.) |
|---|---|
| 4 bedrooms | $4,397/mo |
| 3 bedrooms | $3,987/mo |
| 2 bedrooms | $3,343/mo |
| 1 bedroom | $2,800/mo |
These are benchmark rents, not asking rents. HUD sets them at the 40th percentile of standard-quality units, so a nice single-family will ask more — which is why the links are not capped at the figure beside them.
HUD FY2027 Small Area Fair Market Rents for Woburn’s ZIP codes
Home values over the last decade
| If a $825k house grew at… | 5 yrs | 10 yrs | 15 yrs | 30 yrs |
|---|---|---|---|---|
| 5.4% — Woburn’s own last decade | $1.07M | $1.40M | $1.82M | $4.00M |
| 3% — inflation, holding its real value | $956k | $1.11M | $1.29M | $2.00M |
These are not forecasts. They are what $825k becomes at a fixed rate, shown for two rates because nobody can tell you which one the next thirty years will bring. The last decade included a period of unusually fast growth across Massachusetts; repeating it for thirty years would be a strong assumption. The inflation row is the conservative case — a house that holds its value and earns nothing beyond it. History from the Zillow Home Value Index, a whole-town index that sits at a different level from the 4BR estimate above and is used here for the trend.
What’s around Woburn
dense suburb
| What’s here | Count |
|---|---|
| Cafés and coffee shops | 6 |
| Bookshops | 0 |
Museums, theatres and galleriesSee the list1 more is mapped without a name, so it cannot be listed. | 2 |
| Colleges and universities | 0 |
| Public library | Woburn Public Library |
Density is Census population over land area. Café, bookshop and culture counts are what is mapped in OpenStreetMap — a volunteer map, so a well-mapped town looks busier than a thinly-mapped one. Read a low count as “little mapped here”, not “nothing here”. Colleges are active degree-granting institutions in the federal IPEDS directory; enrolment and campus housing capacity are its 2023 figures. The public library comes from the Massachusetts Board of Library Commissioners, which lists library systems rather than every branch. These figures describe places, never the people in them — see our methodology.
Census snapshot
| ACS 2020–2024, US Census Bureau | Share |
|---|---|
| Homeowner households | 56% |
| White (non-Hispanic) | 72% |
| Asian (non-Hispanic) | 8.0% |
| Latino / Hispanic | 8.1% |
| African American (non-Hispanic) | 4.4% |
Town spending & civic data
| Woburn | Figure |
|---|---|
| Residents | 40,876 |
| Municipal budget | $193.7M |
| School district spending | $113.8M |
| Spending per pupil | $24,148 |
| School spending per resident | $2,784 |
| Subsidized housing (Ch. 40B) | 10.72% |
Budget: FY2025 General Fund total expenditures, DLS Schedule A · Schools: DESE Per Pupil Expenditure · Subsidized housing: Ch. 40B Subsidized Housing Inventory, EOHLC, as of 30 September 2025; the percentage is over year-round housing units counted in the 2020 Census. Never used to rank or filter towns.
Realistic alternatives to Woburn
Surprisingly similar in character
More on Woburn
- Train commute to
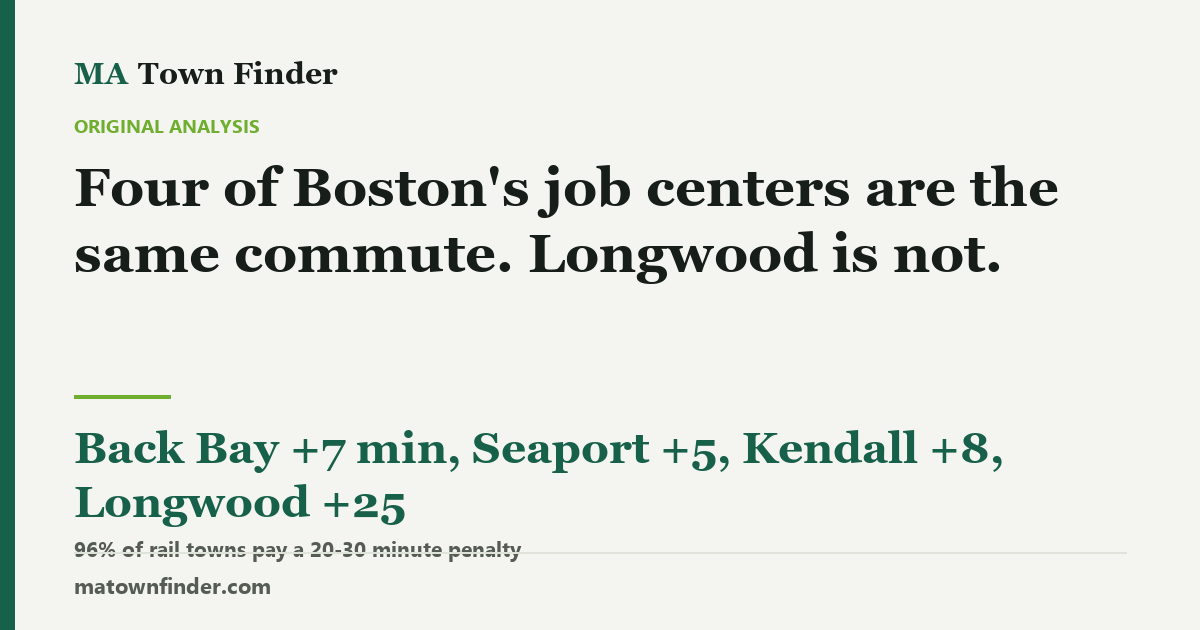
- Kendall Square · about 43 minLongwood Medical Area · about 56 minthe Seaport · about 39 minBack Bay · about 39 minDowntown Boston · about 30 min
Read next
Data statusdata updated October 9, 2026
| Figure | Status |
|---|---|
| Home prices | Estimate |
| Median value by bedroom count | Sourced |
| Property tax rate | Sourced |
| Census shares and homeownership | Sourced |
| Rents | Sourced |
| School data | Sourced |
| Commute | Measured + modeled |
This town’s prices are estimates calibrated against Zillow and Redfin, as described in our methodology. Its tax rate, like every town’s, is the state’s certified FY2026 figure. Data last updated . Full detail on every source is in the methodology.
