A school rating is an average. Of how many schools?
In 18 Massachusetts towns the district is one school, so the rating is a promise about the exact building your child attends. In Boston it averages 78, and those schools are not the same place — the largest elementary holds five times the smallest.
Every school rating a family reads — the MCAS percentile, the district tier, the Niche grade — is an average across a whole district. That is fine when the district is small. It quietly stops being fine as the district grows, and nobody tells you which kind you are looking at.
Now that every town page here lists its individual public schools, the hidden denominator is countable. Across 223 Massachusetts towns, the number of elementary schools a rating is averaging over runs from 1 to 78. The median town has 4. The same three-digit percentile means something completely different at the two ends.
How many schools is the rating hiding?
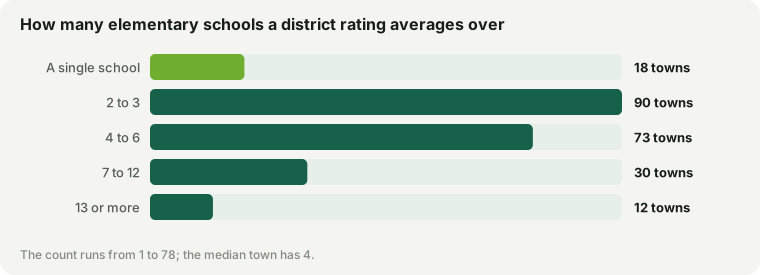
| Elementary schools in the town | Towns |
|---|---|
| A single school | 18 |
| 2 to 3 | 90 |
| 4 to 6 | 73 |
| 7 to 12 | 30 |
| 13 or more | 12 |
When the rating is a promise
In 18 towns there is a single public school serving the elementary grades. Here the district rating is not an average of anything — it is that one building, the one your child will walk into. There is no better school across town to miss out on and no worse one to be zoned into. The rating is a promise.
And in four of them it is a very good promise. Carlisle, Dover, Sherborn and Harvard are all Tier 1 districts that are also a single school — Carlisle at the 99th percentile, Dover the 95th, each one school and no asterisk. If certainty is what you are buying, a top-rated single-school town is the purest form of it on the market.
| Single-school town | District tier | MCAS percentile | School enrolment |
|---|---|---|---|
| Carlisle | Tier 1 | 99th | 609 |
| Dover | Tier 1 | 95th | 457 |
| Sherborn | Tier 1 | 93rd | 393 |
| Harvard | Tier 1 | 92nd | 446 |
| Halifax | Tier 3 | 70th | 530 |
| Plympton | Tier 3 | 67th | 255 |
| Hull | Tier 3 | 63rd | 427 |
| Sturbridge | Tier 3 | 60th | 795 |
| Millis | Tier 3 | 57th | 597 |
| Nahant | Tier 3 | 49th | 175 |
The 18 single-school towns, strongest districts first (top 10 shown).
When the rating is a shrug
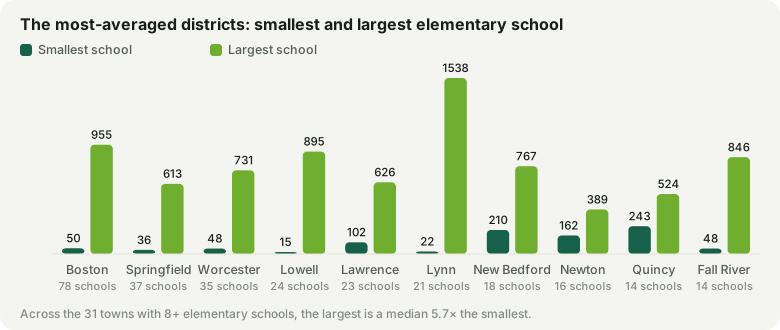
At the other end are the cities, where one number stands in for dozens of schools that are visibly not the same place. Boston averages 78 elementary schools into a single district figure. Springfield averages 37, Worcester 35.
| City | Elementary schools | Smallest | Largest | District MCAS |
|---|---|---|---|---|
| Boston | 78 | 50 | 955 | 22nd |
| Springfield | 37 | 36 | 613 | 6th |
| Worcester | 35 | 48 | 731 | 16th |
| Lowell | 24 | 15 | 895 | 24th |
| Lawrence | 23 | 102 | 626 | 5th |
| Lynn | 21 | 22 | 1,538 | 2nd |
| New Bedford | 18 | 210 | 767 | 8th |
| Newton | 16 | 162 | 389 | 91st |
| Quincy | 14 | 243 | 524 | 53rd |
| Fall River | 14 | 48 | 846 | 5th |
Enrolment is the crudest possible measure of difference, and even it screams: across the 31 towns with eight or more elementary schools, the largest school is a median of 5.7 times the size of the smallest. A district that runs a school of fifty children and a school of nine hundred is not running one interchangeable thing that a single percentile can describe.
This site has already caught the sharper version of the same problem from two other angles: the US News ranking calls Boston a top school town on the strength of one exam school, and the charter numbers show a single city holding schools near the top of the state and near the bottom at once. A city’s district average is the midpoint of a wide spread, not a description of the school down your street.
How to read a rating, then
Before you trust a district number, count the schools behind it — every town’s list is now on its page here.
- One or two schools: the rating is close to a guarantee. What you see is what your child attends.
- A handful: the rating is a fair guide, but the specific assigned school and any redistricting are worth a look.
- A dozen or more: treat the district number as a starting point only. Which school you are zoned into, whether the city assigns by address or by choice, and the charter lottery all matter more than the average — and the average can be well above or below the school you would actually get.
A rating is not wrong for being an average. It is just incomplete in a way that scales with the size of the district, and the fix is the one question the rating never prints: of how many schools?
How this was measured
The public elementary schools of each town, from the DESE 2025-26 enrolment-by-grade report — the same list now shown on every town page. A school counts if it enrols any grade from kindergarten through five, which is the school a family with a young child faces. Charter schools are excluded; they are public but allocated by lottery, not by the district. A regional district’s schools count for each of its member towns. District tiers and the MCAS percentile are this site’s existing district figures, built from state assessment data. Boston is counted as one district; its neighbourhoods do not assign by address. Figures as of September 11, 2026. Every town’s schools are on its page in the town finder.