Cape Cod has the lowest tax rates of any region, and spends the most per pupil
Nine of the twelve lowest residential tax rates among the 223 towns this site covers are on Cape Cod, and the median Cape bill is $4,890 against $8,786 across all 223, on houses priced at the same median. Yet it spends $24,828 per pupil, more than any other region. Two other things are true of nowhere else: every Cape town this site covers is Tier 3, the only region of twelve with a single school tier, and four of the ten steepest steps from a three-bedroom home to the top of the market are here.
Every regional piece on this site so far has been about the North Shore, which is an accident of where the questions came from rather than a judgment about where the interesting data is. Put the twelve regions side by side and the Cape is the one that looks least like anywhere else in Massachusetts — on four separate measures, in four separate directions.
Every comparison here is across the 223 cities and towns this site covers, which leaves out the Islands and most of the small western towns, so “statewide” below means those 223.
The lowest tax rates of any region, by a distance
Nine of the twelve lowest residential tax rates among the 223 towns this site covers belong to Cape towns. The lowest of them is Chatham at $3.67 per $1,000, against a median of $12.31 across all 223.
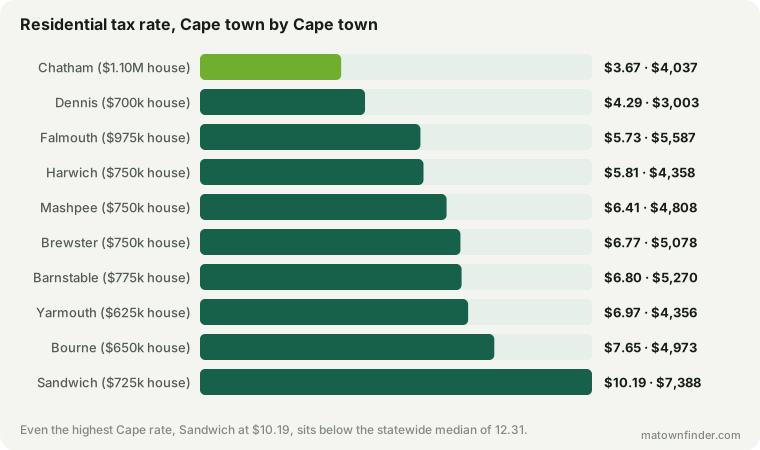
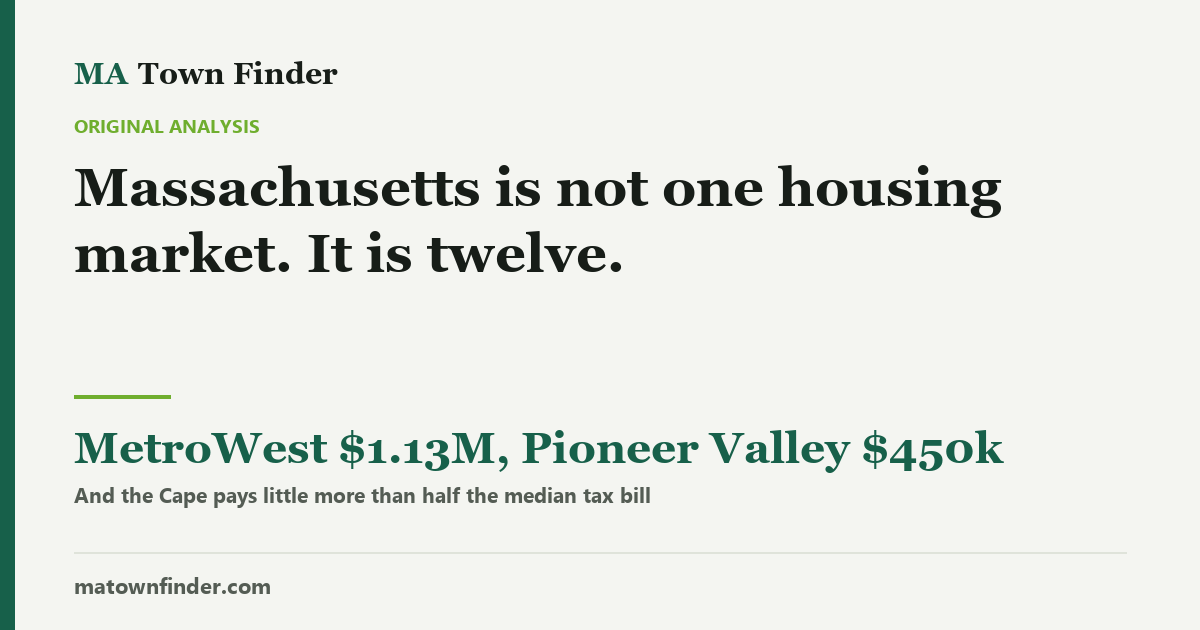
A low rate is usually a bad guide to the bill, because a cheap rate on a dear house is how the two most often invert. Not here. The Cape’s median house is priced at $750k against $750k across all 223 — effectively the same house — and its median bill is $4,890 against $8,786. That is 44% off the typical bill for a house at the typical price, which is about as clean a comparison as this data ever offers.
And the highest school spending of any region
The Cape spends $24,828 per pupil, more than any of the other eleven regions and $3,371 above the median across all 223.
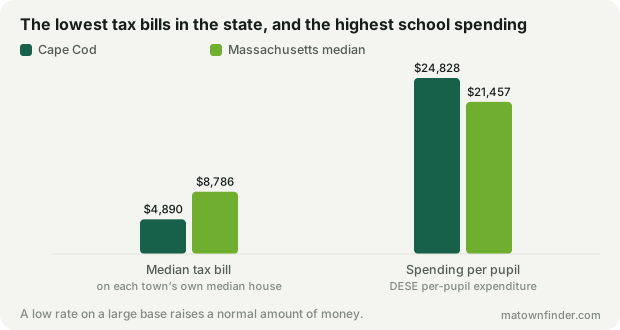
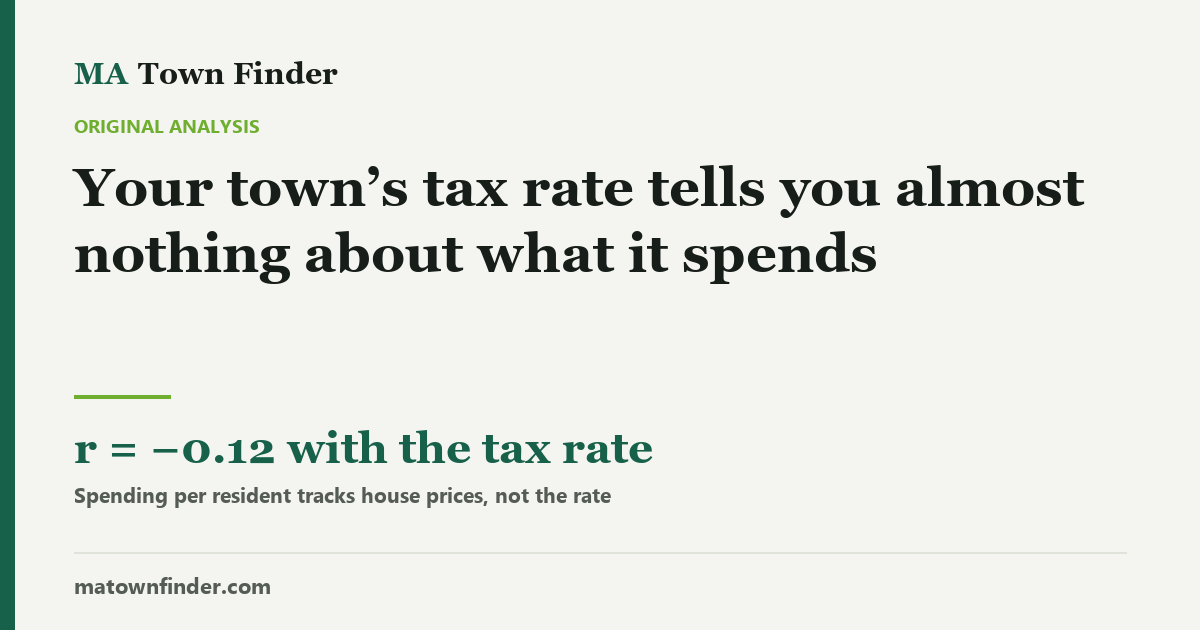
Those two facts look contradictory and are not, and the resolution is already published here: what a town spends tracks its property wealth, not its tax rate. A low rate applied to a large enough base raises a normal amount of money. The Cape is that finding in its purest available form — the only region where the whole set of towns sits at one end of the rate distribution and the other end of the spending one.
Every Cape town is Tier 3
This is the one that changes how you shop. All 10 Cape towns this site covers land in the same school tier. It is the only region of the twelve where that is true — everywhere else in Massachusetts spans at least two tiers, and most span three or four.
The median MCAS percentile across the Cape is the 42nd against the 56th statewide, and the median graduation rate is 90.1% against 93.8% — the lowest graduation rate of the 12 regions, and 3rd-lowest on MCAS, despite the highest spending. It is also the region where the graduation rate is doing the most work, since it is one of the few places in the state where that number drops far enough to say something.
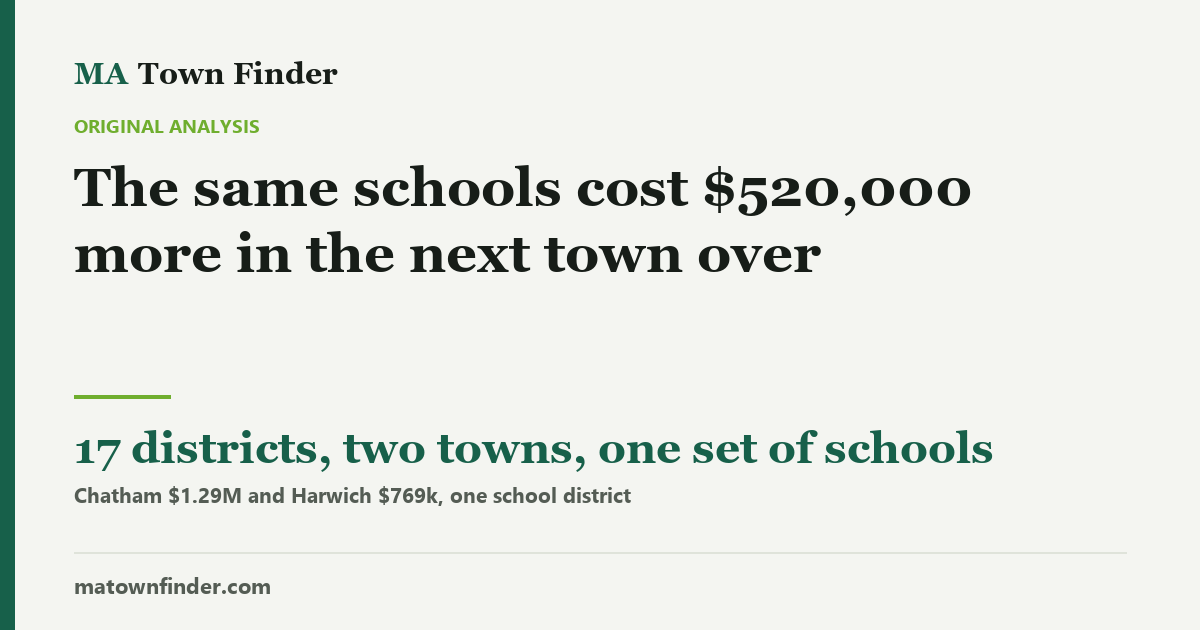
The practical consequence: the question a buyer asks everywhere else in Massachusetts — which town here has the better schools — has no answer on the Cape. There is nothing to trade. What is left is water, commute and tax, and those do vary, which is what the rest of this piece is about. Note also that ten towns are only 8 school systems: two of the districts are shared, and one of them spans the widest price gap in the state.
Space costs more here than anywhere
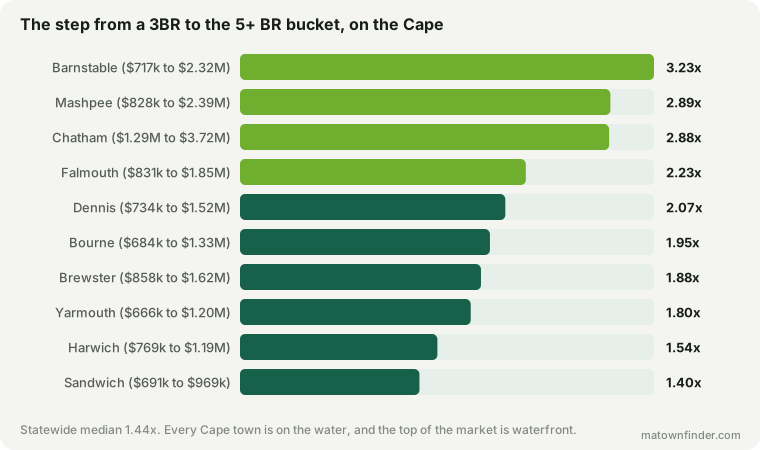
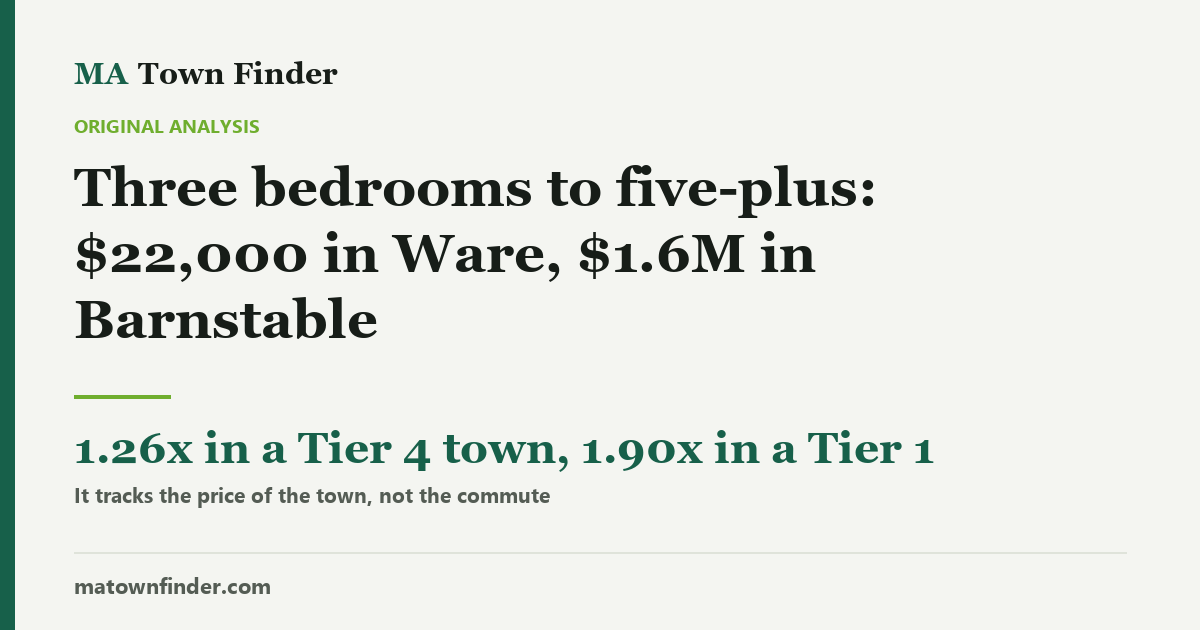
The Cape’s median step from a three-bedroom home to the 5+ BR bucket is 2.01x against 1.44x statewide, the steepest of the twelve regions. Four of the ten steepest steps statewide are Cape towns — Barnstable (3.23x), Mashpee (2.89x), Chatham (2.88x), Falmouth (2.23x).
The reason is not a mystery and is worth saying plainly: the top of the market here is waterfront, and the top bucket is open-ended — five bedrooms or more — so it carries the largest houses in the town. Read it as what moving up this market costs, not as the price of two bedrooms. Either way the conclusion for a family holds: the entry price on the Cape is ordinary and the price of space is not.
The ten towns
| Town | 4BR | Rate | Bill | Commute | MCAS | 3BR → 5+ BR |
|---|---|---|---|---|---|---|
| Chatham | $1.1M | $3.67 | $4,037 | 113 min | 56th | 2.88x |
| Dennis | $700k | $4.29 | $3,003 | 102 min | 29th | 2.07x |
| Falmouth | $975k | $5.73 | $5,587 | 96 min | 53rd | 2.23x |
| Harwich | $750k | $5.81 | $4,358 | 106 min | 56th | 1.54x |
| Mashpee | $750k | $6.41 | $4,808 | 97 min | 31st | 2.89x |
| Brewster | $750k | $6.77 | $5,078 | 104 min | 62nd | 1.88x |
| Barnstable | $775k | $6.80 | $5,270 | 98 min | 20th | 3.23x |
| Yarmouth | $625k | $6.97 | $4,356 | 101 min | 29th | 1.80x |
| Bourne | $650k | $7.65 | $4,973 | 88 min | 27th | 1.95x |
| Sandwich | $725k | $10.19 | $7,388 | 91 min | 73rd | 1.40x |
Commute is to downtown Boston, which for most people buying here is not the relevant journey — Bourne is the nearest at 88 minutes and Chatham the furthest at 113.
What this leaves out
The Cape Cod Commission’s roster is 15 towns and this site holds 10 of them. The five it does not — Orleans, Eastham, Wellfleet, Truro, Provincetown — are the Outer Cape, the smallest and most seasonal of the fifteen. Everything above therefore describes the Upper and Mid Cape and should not be read as the peninsula entire.
Two other absences worth naming. Nothing here measures seasonality: the share of housing that is a second home, the summer swing in population, the rental economy that sits on top of both. Those are the facts most often cited about the Cape and this site holds none of them, so nothing above depends on them — but they are almost certainly part of why the tax base looks the way it does, and a reader should hold that possibility rather than take the mechanism as settled. And child care is thin: Chatham licenses no infant places in any center and has no home-based program either, one of only two towns in the state in that position.
How this was measured
Regions are the published rosters of the regional planning agencies — here the Cape Cod Commission — rather than lines drawn for this site. Region figures are medians across the towns in the region, unweighted by population, so they describe the set of places rather than the people in them; with ten towns, one town moves them.
Prices are this site’s modeled median 4BR and tax rates are FY2026 residential rates from the municipal assessors; the bill is rate times price. MCAS percentiles and graduation rates are DESE’s. Per-pupil spending is DESE’s per-pupil expenditure report, which belongs to the district rather than the town, so the shared districts report one figure to each member. Bedroom medians are Zillow’s observed ZHVI. See the methodology, the Cape Cod region page, or download the tables. Figures as of September 11, 2026.