The graduation rate cannot tell a $450,000 district from a $2.9M one
In 96 of 222 Massachusetts towns, the local district graduates 95% or more of its students, and those towns run from $450,000 to $2.9M. The top three quarters of them fit inside 9.3 percentage points, so the measure has no room left to separate anybody: Weston is 97.7% at $2.9M, Southwick 96.5% at $450,000. The highest rate here is not in a Tier 1 town, or a Tier 1 price. What the number does do is find the floor — and that part is worth reading.
The four-year graduation rate is the most intuitive number in school data. It needs no explanation, no percentile, no comparison group: this share of the students who started ninth grade together finished in four years. It sits on every listing site and in every relocation guide, and a buyer reads it as a quality score.
It is not one, and the reason is arithmetic rather than methodology. Massachusetts graduates nearly everybody.
The measure has no room left
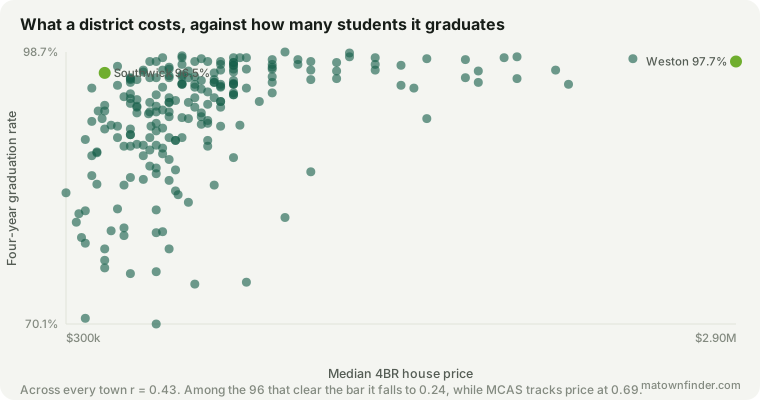
Across the 222 towns here, the median rate is 93.8%. 160 are at 90% or above. 96 are at 95% or above. From the twenty-fifth percentile to the highest rate here is 9.3 percentage points — the top three quarters of these towns, squeezed into a band narrower than the error bar most people would put on the number.
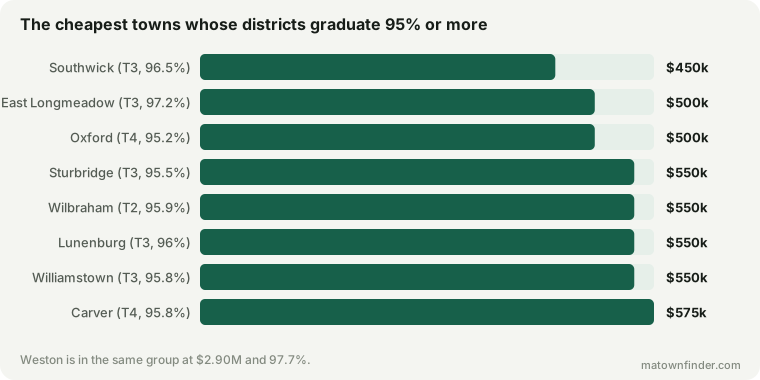
Those 96 towns at 95% and above run from $450k to $2.9M. Southwick graduates 96.5% and has a median 4BR of $450k. Weston graduates 97.7% and has a median 4BR of $2.9M. That is $2.45M for 1.2 percentage points.
Where the number does not separate
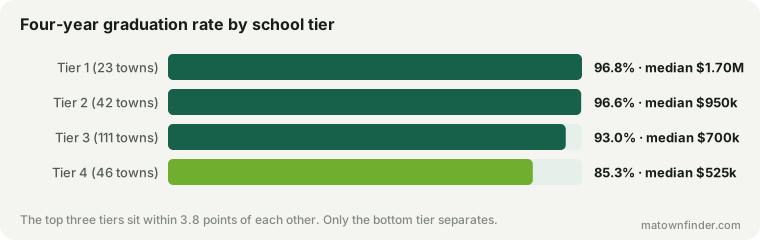
By school tier the compression is exact. Tier 1 districts graduate a median 96.8%. Tier 2 districts graduate 96.6% — a difference of 0.2 points, across a median price difference of $750k.
The best graduation rate here is not in a Tier 1 town, and not at a Tier 1 price: it is Bedford, a Tier 2 district at $1.15M, graduating 98.7%. The best Tier 3 district on this measure — Berlin, at $750k — graduates 98.3%, ahead of the best Tier 1 district.
Test the measure the way you would test any ranking: if it ordered districts by quality, then inside the group that clears the bar the better ones should still cost more. They barely do. Among the 96 towns at 95% and above, graduation rate and price correlate at r = 0.24. Across all 222 it is 0.43, while MCAS — the figure people distrust more — tracks price at 0.69.
And the graduation rate is largely a noisier restatement of that same MCAS figure: r = 0.78 between the two across 222 towns. A buyer who has read one has read most of the other, without knowing it.
What it is genuinely good for
Everything above is an argument against using it to rank. It is not an argument against reading it, because the bottom of this distribution is doing real work.
Tier 4 districts graduate a median 85.3% against Tier 3’s 93.0%. The lowest here is Chelsea at 70.1% — roughly three students in ten not finishing in four years. That is not a ranking signal; it is a fact about a place, and it is one no other figure on a listing states.
| Lowest ten | Graduation | Tier | 4BR |
|---|---|---|---|
| Chelsea | 70.1% | T4 | $650k |
| Winchendon | 70.7% | T4 | $375k |
| Framingham | 74.3% | T3 | $800k |
| Waltham | 74.5% | T3 | $1M |
| Brockton | 75.4% | T4 | $550k |
| Lynn | 75.6% | T4 | $650k |
| Spencer | 76% | T4 | $450k |
| Fall River | 76.8% | T4 | $450k |
| Webster | 78% | T4 | $450k |
| Everett | 78% | T4 | $700k |
Note the price column, which is the reason this list is worth reading rather than assuming. The bottom of the graduation distribution is not simply the bottom of the price distribution: Framingham ($800k, 74.3%) and Waltham ($1M, 74.5%) sit in the lowest ten here. A buyer who inferred the graduation rate from the asking price would have both of them wrong.
The fourth number that does not do what buyers think
This is the same finding as three other pieces here, arrived at from a fourth direction. Per-pupil spending fails because it measures the wrong thing. MCAS achievement fails because it substantially measures the intake. A single district rating fails because it averages buildings a child will never attend. The graduation rate fails differently and more simply: there is nothing left to measure at the top.
The figure that survives all four objections is the one the state publishes free and nobody quotes — its own accountability determination, which grades a district against where it was rather than against everyone else.
How to use this
- Use it as a floor test, not a ranking. Below about 85% it is telling you something urgent. Above 95% it is telling you the town is one of 96, which is not a shortlist.
- Do not pay for the last two points. They are available at $450k and at $2.9M, and the difference between those two towns is not the graduation rate.
- If you have already read the MCAS percentile, you have mostly read this. The two move together at 0.78. Spend the attention on growth instead, which measures something neither of them does.
How this was measured
Four-year cohort graduation rates are DESE’s own, as carried in this site’s school data for the 222 municipalities that have one, matched to each town’s resident-serving district. Boston’s 18 neighborhoods are excluded: they share the citywide district figure, and counting it 18 times would weight one district as heavily as a fifth of the state.
A regional district shared by several towns carries one rate, so its member towns each report it — which is exactly correct, and the subject of its own study. Prices are this site’s modeled median 4BR, calibrated to the Zillow Home Value Index and Redfin. School tiers are editorial and are shown next to the state’s own figures throughout — see the methodology, or download the school table. Figures as of September 11, 2026.