Salem vs Beverly vs Swampscott vs Marblehead: which North Shore town fits your family?
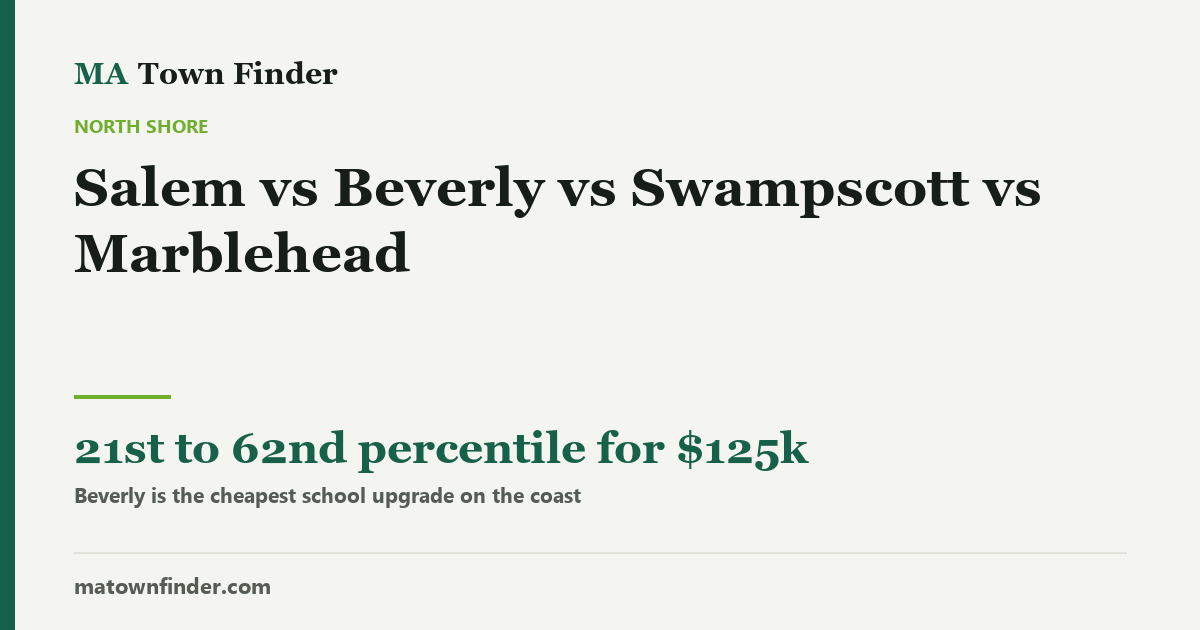
Four towns within twenty minutes of each other, and almost nothing in common once you look past the coastline. One of them nearly triples the school percentile for $125k.
I live in Salem, and these are the four towns my family actually weighed. They sit within about twenty minutes of each other on the same stretch of coast, which makes them feel interchangeable from outside and nothing alike once you have the numbers side by side.
The whole comparison
| Salem | Beverly | Swampscott | Marblehead | |
|---|---|---|---|---|
| School tier | Tier 3 | Tier 3 | Tier 2 | Tier 2 |
| MCAS percentile | 21st | 62nd | 57th | 82nd |
| Graduation rate | 86.3% | 89.4% | 93.5% | 97.6% |
| Niche district rank | unranked | 101st | 77th | 44th |
| 4BR house | $725k | $850k | $1.05M | $1.35M |
| 3BR townhouse | $575k | $650k | $780k | $900k |
| 3BR rent | $3,343/mo | $3,277/mo | $3,343/mo | $3,343/mo |
| Tax rate / $1,000 | $10.78 | $10.81 | $12.00 | $8.56 |
| Est. annual tax bill | ≈$7,800 | ≈$9,200 | ≈$12,600 | ≈$11,600 |
| Commute to Boston | 47 min | 54 min | 43 min | 56 min |
| Commuter rail | 38 min | 42 min | 31 min | None |
| Compact center | 9/10 | 7/10 | 7/10 | 7/10 |
| Energy | 9/10 | 7/10 | 6/10 | 6/10 |
| Culture | 10/10 | 8/10 | 7/10 | 8/10 |
| Visitor presence | 10/10 | 6/10 | 8/10 | 8/10 |
| Family amenities | 7/10 | 6/10 | 7/10 | 7/10 |
| Charter options nearby | 3 | 1 | 4 | 2 |
| Private options nearby | 15 | 17 | 14 | 16 |
The finding that matters most
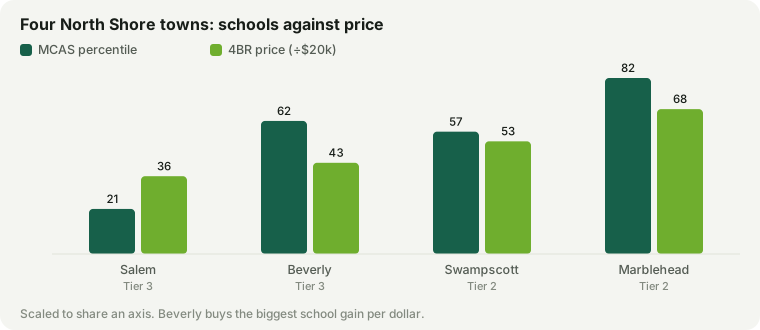
Beverly is the cheapest school upgrade on this coast, by a wide margin. Salem’s district sits at the 21st percentile statewide on MCAS. Beverly’s sits at the 62nd — nearly three times the percentile — for about $125k more on a 4BR, on the same commuter rail line, 42 minutes to a downtown terminal against Salem’s 38.
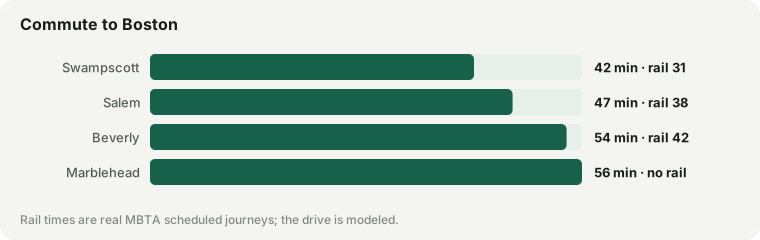
Marblehead has the strongest schools of the four by the publishers’ reckoning (44th of 236 on Niche, 97.6% graduation) and the highest price to match at $1.35M. It also has no commuter rail, and a 56-minute modeled peak commute — the longest of the four. That is the trade nobody mentions in the listings.
The tax bills invert the prices
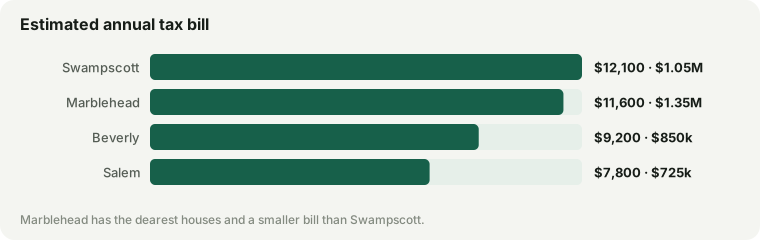
This is the clearest local example of something we found statewide: a low rate does not mean a low bill, and here it runs the other way too.
Marblehead is the most expensive house on this list at $1.35M, yet its estimated annual tax bill of ≈$11,600 is lower than Swampscott’s ≈$12,600 on a $1.05M house. The reason is the rate: $8.56 in Marblehead against $12.00 in Swampscott. If you shortlist on rate you will rank these two backwards; if you shortlist on price you will also rank them backwards.
What each one is actually for
- Salem — if you want a downtown more than a school ranking. It is the cheapest of the four to buy ($725k) and the cheapest to hold (≈$7,800 a year), and it has the most compact centre (9/10), most cultural (10/10) and busiest (9/10) place on this list by some distance. It is also the weakest district of the four. Both of those are true at once, and I say that as a resident.
- Beverly — the value pick. A large share of Marblehead’s school advantage for roughly half the price premium, a real downtown, and the same rail line. If you are leaving Salem for schools and nothing else, look here first.
- Swampscott — if the commute is the constraint. The best rail access of the four at 31 minutes and a 43-minute door-to-door, with Tier 2 schools. You pay for it in the tax bill, which is the highest here.
- Marblehead — if schools and the harbour are the point and you do not commute daily. Best schools, best graduation rate, genuinely beautiful, no train. Fine if you work locally or remotely; punishing five days a week.
What this comparison leaves out
- Tourism is a daily fact, not a footnote. Salem scores 10/10 on visitor presence — the highest here. In October that is not an abstraction; it is your parking, your commute and your downtown. Marblehead and Swampscott get a summer version of the same thing.
- A district percentile is not your child’s classroom. MCAS is a district-level average. Schools vary within a district, and the right fit for a particular child is not something any percentile can tell you.
- Prices and commutes are estimates. Prices are calibrated to the Zillow Home Value Index and Redfin; commute times are modeled from distance with corridor adjustments, not measured by a routing API, though the rail leg now comes from the MBTA timetable. Both point at downtown Boston. If you work in Burlington or along 128, Marblehead’s penalty shrinks.
School data from MA DESE; publisher ranks from Niche; prices and tax bills are estimates; commutes are modeled, with rail legs from the MBTA timetable; vibe scores from our six-dimension model. Data last reviewed . Next: stay in Salem, move, or pay for private school? — the same four towns, priced against tuition.