Nine kinds of Massachusetts town, compared
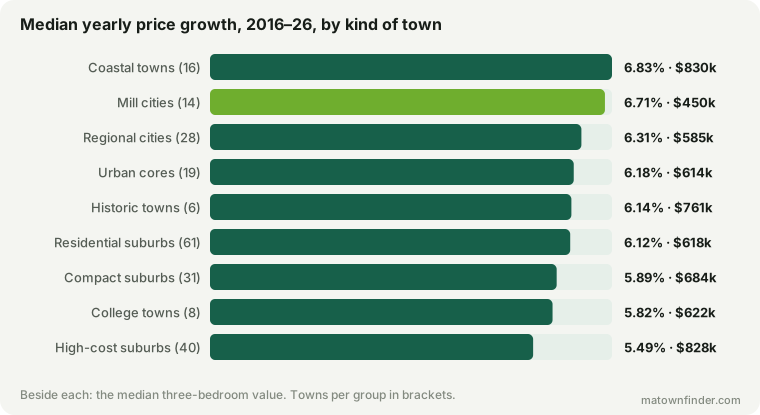
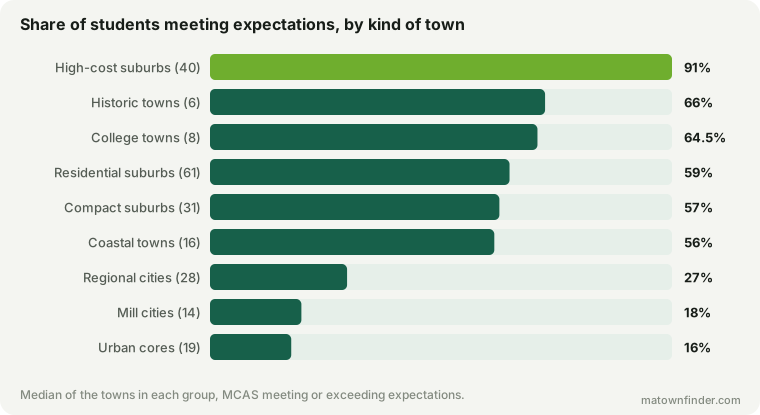
This site sorts every Massachusetts town into one of nine kinds of place. Side by side, the mill cities have the cheapest homes, a median $450k for three bedrooms, and grew 6.71% a year, second only to the coast. The high-cost suburbs, 34 of 40 of them in the top school tiers, grew slowest at 5.49%. The coastal towns are as dear as the high-cost suburbs, grew fastest and pay the lowest tax rate. The labels are editorial calls, and the piece says so.
This site sorts every Massachusetts town into one of nine kinds of place — residential suburbs, high-cost suburbs, mill cities and the rest — and each has a page listing its members. This sets the nine side by side on the measures the site trusts most.
One thing first. The labels are editorial calls, not a sorting of the numbers: each town carries a detailed description from its profile, and those are mapped onto nine groups by hand. So a difference between two kinds of town is a difference between two groups someone chose. It describes the groups; it does not show that being a “mill city” causes anything.
The nine at a glance
| Kind of town | Towns | 3-bed home | Growth a year | Drive to Boston | MCAS | Tax rate | People / sq mi |
|---|---|---|---|---|---|---|---|
| Residential suburbs | 61 | $618k | 6.12% | 68 min | 59% | $13.06 | 601 |
| High-cost suburbs | 40 | $828k | 5.49% | 50 min | 91% | $12.65 | 914 |
| Compact suburbs | 31 | $684k | 5.89% | 44 min | 57% | $11.74 | 2,115 |
| Regional cities | 28 | $585k | 6.31% | 70 min | 27% | $12.02 | 1,869 |
| Urban cores | 19 | $614k | 6.18% | 40 min | 16% | $11.48 | 8,490 |
| Coastal towns | 16 | $830k | 6.83% | 89.5 min | 56% | $8.11 | 678 |
| Historic towns | 6* | $761k | 6.14% | 91 min | 66% | $12.80 | 543 |
| Mill cities | 14 | $450k | 6.71% | 85 min | 18% | $12.69 | 638 |
| College towns | 8* | $622k | 5.82% | 66 min | 64.5% | $13.83 | 1,119 |
Medians within each group. * Fewer than 10 towns: one reclassification can move these figures.
What stands out
The mill cities: cheapest homes, near-top growth
The 14 mill cities have the cheapest homes of any group, a median $450k for three bedrooms against $673k statewide, and grew 6.71% a year over the decade — second only to the coast. None of the 14 has a district in the site’s top two tiers, and the median share of students meeting expectations is 18%. That is the cheap-towns-grew-fastest pattern, seen through a label rather than a price band.
The high-cost suburbs: the strongest schools, the slowest growth
34 of the 40 high-cost suburbs are in the top two school tiers, with a median 91% of students meeting expectations. They also grew slowest of the nine, 5.49% a year — the same pattern from the other end.
The coast: the exception
The 16 coastal towns break the rule. They are about as dear as the high-cost suburbs ($830k against $828k) and yet grew fastest of all, 6.83% a year. They are also the furthest out among the larger groups, a median 89.5 minutes from Boston, and carry the lowest tax rate, $8.11 per $1,000 against $12.31 statewide. The water is the one thing a high price did not slow down; the coastal premium piece prices it.
Density, from one end to the other
The urban cores hold a median 8,490 people per square mile, about 14 times the 601 of the residential suburbs. They are also the closest in, a median 40 minutes, and have the lowest school results, 16%. That combination is why density and distance are so hard to pull apart.
A note on the small groups
Historic towns (6 towns) and college towns (8 towns) are small enough that one town moving in or out shifts their medians. Read those rows as a description of a handful of places — Lexington, Concord, Plymouth; Wellesley, Hudson, Amherst — rather than of a kind.
How to use this
- Start from the kind of place, then compare within it. Each archetype page lists its members, so a shortlist can start from towns that are alike before weighing price and schools.
- Don’t read the label as a verdict. Every group spans a wide range — the high-cost suburbs run from Longmeadow at $485k to Weston at $1.54M.
- For a region instead of a type, the twelve regions are compared here.
How this was measured
Each town’s kind is its archetype on this site, mapped by hand from the description in its profile. Prices are Zillow’s observed July 2026 value for a three-bedroom home; growth is the compound annual change in Zillow’s all-homes index from 2016 to 2026; MCAS is the share of students meeting or exceeding expectations; density is census population over town area. All figures are medians within each group, across 223 towns. Boston’s neighborhoods share the city’s figures and count once. See the methodology, or download the tables. Figures as of October 9, 2026.