Last year’s hottest Massachusetts towns are rarely this year’s
Many “hottest market” lists are one year of price growth sorted from the top. Ten years of Zillow data say that ranking has lately predicted almost nothing: in each of the last four years, only one or two of the 20 fastest-growing Massachusetts towns were back in the top 20 the next — about what two random lists would share. Even the decade’s steadiest pattern, the cheap towns growing fastest, reversed outright in two of its ten years.
Every year brings lists of the hottest housing markets. Some rank places by how fast homes sell or how many buyers are looking; many rank them by the simplest thing of all, one year of price growth sorted from the top. That second kind is the one tested here, and the question almost nobody asks of it is whether it predicts anything: whether the towns at the top this year are any likelier than the rest to be there next year.
Ten years of Zillow’s index for the 223 towns here answer it. Mostly not, and lately almost never.
Last year’s top twenty, this year
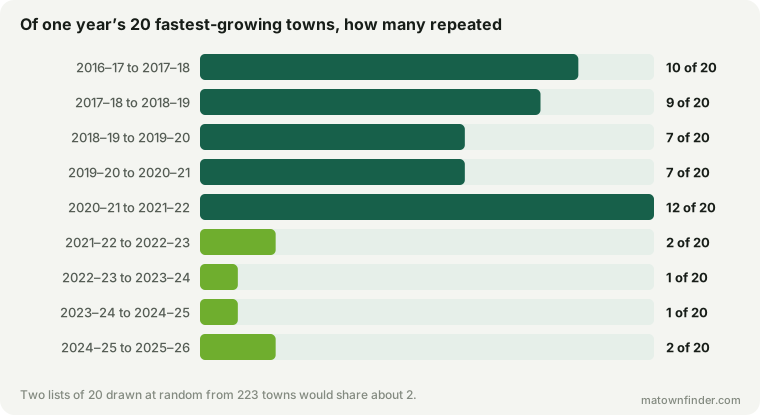
In each of the last four years, of the 20 towns whose prices rose fastest, between one and two were back in the top 20 the year after. With 223 towns to choose from, two lists drawn at random would share about two. Lately, a one-year ranking by price growth has done no better than chance.
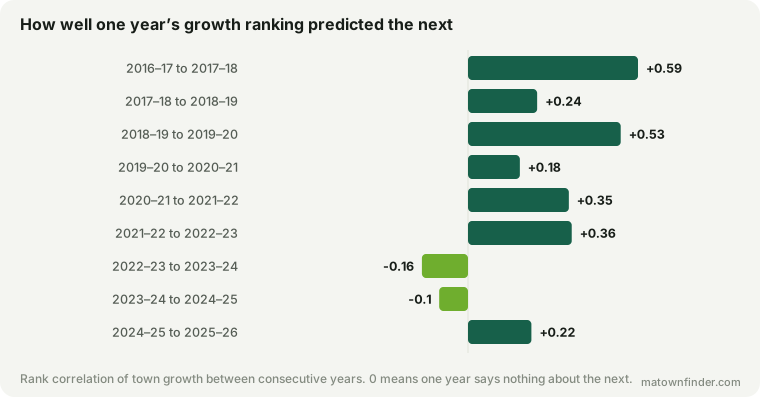
It was not always so. Early in the decade a year’s leaders kept around half their places — 10 of 20 in the first pair of years, and the ranking correlated with the next year’s at r = 0.59. Across all nine pairs the median is 0.24, and the last three have run between −0.16 and 0.22.
This year’s list, with that in mind
For the record, and as a list rather than a forecast: in the year to 2026 the fastest risers were Hingham (6.9%), Scituate (6.1%), Norwell (5.8%), Westport (5.6%), Cohasset (5.6%). At the other end, 8 towns fell, led by Brookline (−4.9%), Cambridge (−1.5%), Boston (−1.3%).
By the record of the last four years, perhaps two of this year’s top 20 will still be there next year. Which two, nothing in this data can say.
Even the big pattern flips year to year
The steadiest thing this site has found about Massachusetts prices is that the cheapest towns grew fastest over the decade. It is true of the decade. It is not true of every year in it.
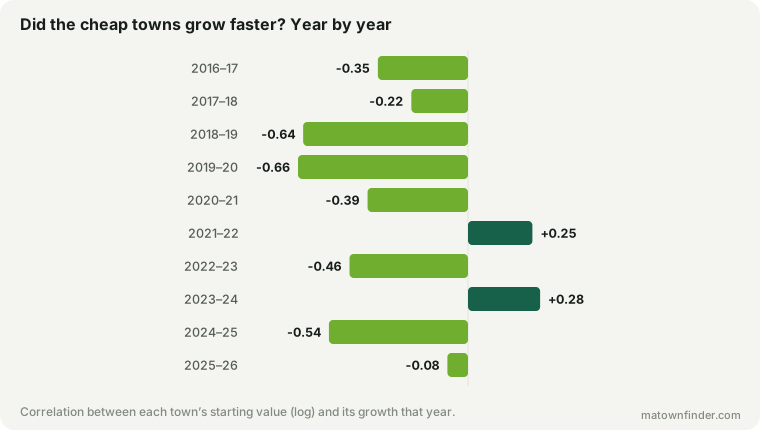
In two of the ten years — 2021–22 and 2023–24 — the dearest towns outgrew the cheapest. The latest year sits near zero, at −0.08. Anyone tempted to read one year as the end of the decade’s pattern should look at how often it has “ended” before.
What this does not say
It does not say that long-run growth is random, and the reason is worth spelling out because it is easy to overreach here. Over multi-year stretches, whether the leaders keep leading depends on where the stretch is cut. The pandemic boom predicted the years after it (r = 0.39, 2019–2022 vs 2022–2026) — the towns that boomed hardest kept growing fastest. Split the decade in half instead and the two halves have nothing to do with each other (2016–2021 vs 2021–2026: r = −0.07).
So the claim here is deliberately narrow. It is about one year’s ranking by price growth, and that ranking has lately said very little about the next one. Lists built on other measures — sales pace, buyer interest — are a different question, which this data cannot test.
How to use this
- Read a hot list as news, not as advice. It tells you where prices rose this year. It has not recently told anyone where they would rise next year.
- Check the reasons, not the rank. When Peabody was named the hottest ZIP code in the country, the useful work was testing why — the tax bill turned out to be the real story, and unlike the ranking it will still be true next year.
- Buy for the decade, and read the decade. What holds here is slow: where a town starts on price, whether it is on the coast, and what its tax bill costs you every year. One year of price change is mostly noise around those.
How this was measured
Growth is each year’s percentage change in the Zillow Home Value Index, all homes, at the city level, taken at mid-year from 2016 to 2026, for 223 municipalities; Boston’s neighborhoods share the citywide series and count once. Persistence is the rank correlation between consecutive years’ growth across all towns; turnover is how many of one year’s 20 fastest-growing towns were among the next year’s 20. The year-by-year price link is the correlation between each town’s value at the start of the year (log) and its growth over it. See the methodology, or download the tables. Figures as of September 11, 2026.