The pandemic re-priced Massachusetts by distance, and never gave it back
Prices rose most where the commute was longest — an hour out gained 37.4% between 2019 and 2022, the inner ring 25.7%. The half of the story everyone expected next has not happened. Four years past the peak the towns that boomed hardest are still growing fastest, one town in 223 is below its 2022 price, and the gap between the inner ring and the far suburbs has widened by 22 percentage points rather than closing.
The story everybody tells about 2020 has two halves. In the first, people stopped commuting, decided they wanted space, and bid up everything an hour outside the city while the dense inner ring went quiet. In the second — the half that is supposed to have happened by now — offices reopened, the exodus proved temporary, and prices returned to something like their old shape.
The first half is exactly right. The second has not happened at all.
The boom was sorted by distance
Take 223 Massachusetts towns and cut the last seven years into two pieces: the boom, 2019 to 2022, and everything since. Across the state the median town rose 35.3% in the first period.
What decided which towns rose most was not price, or schools, or anything about the town itself. It was how far away it was. Commute to Boston correlates with the size of the boom at r = 0.56. The obvious rival explanation — that this was really about density, about people fleeing crowded places — is much weaker at -0.28, and it is weaker because density and distance are the same thing wearing different clothes: the compact towns here are the close-in ones.
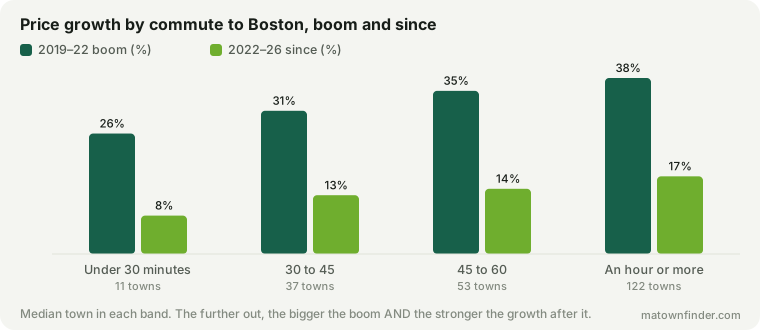
Towns inside half an hour of Boston gained 25.7% across the boom. Towns an hour or more out gained 37.4%. That is the part everyone remembers, and it is true.
Then nothing reverted
Here is where the received story breaks. If the boom had been a bubble, the towns that rose hardest would have given the most back: the correlation between how much a town gained in the boom and how it has done since would be negative. It is +0.44.
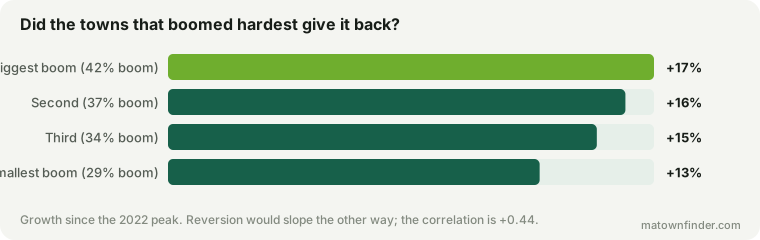
The quarter of towns that boomed hardest — a median 42.4% — have added another 16.7% since. The quarter that boomed least, at 29.4%, added 12.6%. Whatever happened in 2020 did not correct. It set a direction and the market kept walking in it.
Of 223 towns, the number now below their 2022 price is 1: Brookline, down 6.1%. Only 4 have failed to add 5% since the peak, and it is worth naming them because the list is not random: Brookline, Boston, Cambridge, Somerville. That is the urban core — four contiguous places at the centre of the region, served by rapid transit rather than the commuter rail. They are not the state’s most expensive towns, which are mostly Tier 1 suburbs well outside them, and they are not quite its densest either. What they have in common is being the part of Massachusetts whose whole proposition is proximity.
Where that leaves everyone
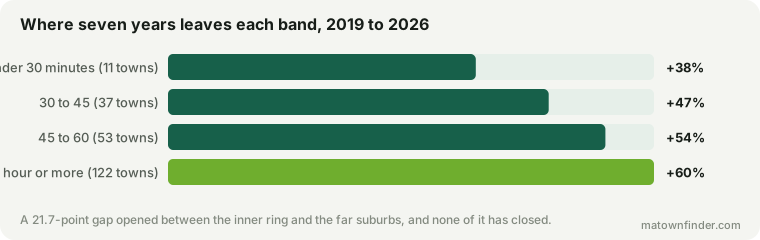
Seven years on from 2019, the inner ring is up 38.0% and the far suburbs are up 59.7% — a gap of 21.7 percentage points.
And that gap is not the continuation of an old trend. Run the same bands over the three years before the pandemic, 2016 to 2019, and the gradient points the other way: the inner ring gained 21.4% while the far suburbs gained 15.7% — a gap of 5.7 points in the opposite direction. Massachusetts spent the late 2010s pricing proximity upwards. Then it stopped, reversed, and has not turned back.
For an owner in a far suburb, that is straightforwardly good news that has already been banked. For a buyer, it means the standard advice to wait out the pandemic premium has been wrong for four years running, and there is nothing in the data suggesting the fifth will be different. And for anyone in Brookline, Boston or Cambridge, it means the thing that felt like a temporary softness is now most of a decade of standing still while the rest of the state compounded.
The apparent contradiction
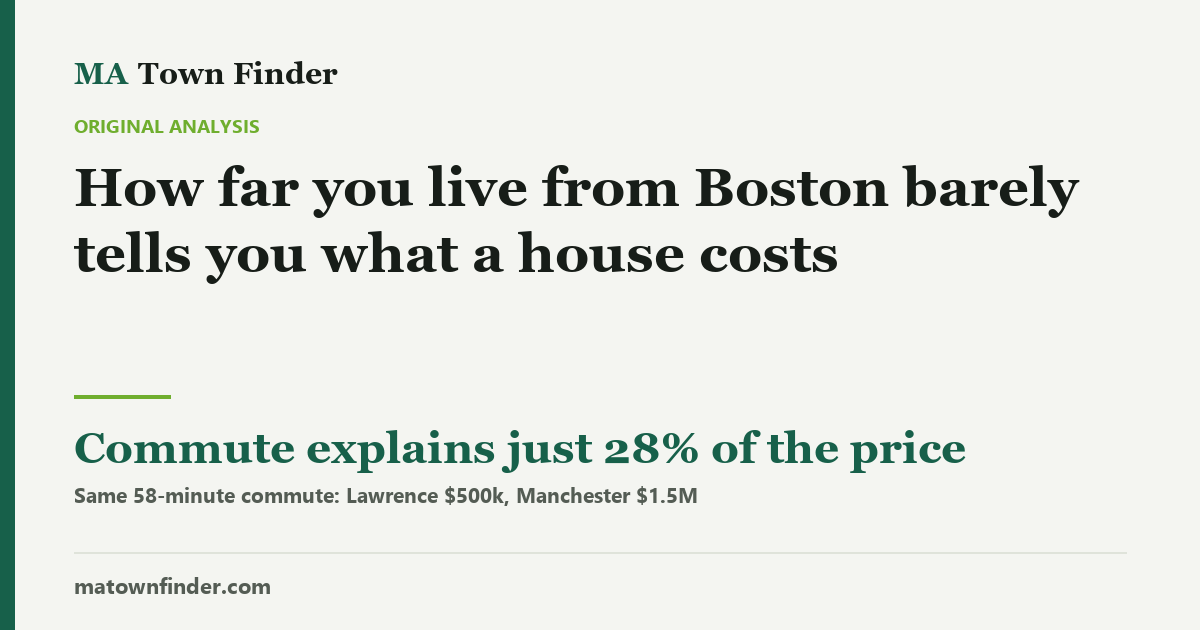
This site has also published a study finding that distance from Boston barely tells you what a house costs, with commute time explaining about 28% of price. That looks like it disagrees with everything above. It does not, and the difference is worth being precise about.
Distance is weak against the level of prices and strong against the change in them. Lawrence and Manchester-by-the-Sea are still the same 58 minutes out at $500k and $1.5M, and no amount of pandemic re-pricing altered that. What changed is that both of them, and every other town at that distance, rose faster than the towns close in. A steep gradient laid over a very noisy map moves everything without making the map any less noisy.
What this does not tell you
These are index values, not transactions. The Zillow Home Value Index is a smoothed estimate of what a typical home in a town is worth, so it is good at direction and less good at any particular house. Mid-year values mean the 2022 figure is a mid-2022 reading rather than the exact top of the market, which for most towns was a few months either side of it.
Nothing here explains why the reversion has not happened, and the honest answer is that this data cannot. Mortgage rates roughly doubled over the same period, which locks existing owners in place and starves the market of listings; remote and hybrid work did not go back to 2019; and Massachusetts builds very little housing anywhere. All three would produce this pattern. Separating them needs transaction and inventory data this site does not have.
How this was measured
Zillow Home Value Index, city level, smoothed and seasonally adjusted, mid-year values for 2019, 2022 and 2026, for the 223 Massachusetts municipalities this site covers. Growth figures are medians across towns rather than dollar-weighted, so a large town counts the same as a small one — the question is what happened to places, not to the market in aggregate.
Boston’s neighbourhoods are excluded throughout: they share one citywide series, so including them would put eighteen identical rows into every median. Commute bands use this site’s modelled door-to-door times; compactness is the vibe model’s built score. See the methodology, or download the price table. Figures as of September 17, 2026.