Walkability, culture, gathering places: none of it moved house prices
Ten years of prices tested against the things people say drive property values. Once you allow for the fact that cheap towns grew fastest, none of the six town-character measures predicts anything at all. One thing survives, and it is the water.
There is a standard list of things that are supposed to make a town appreciate. A walkable centre. Good restaurants and a bit of culture. Places to gather. Amenities for families. Strong schools. This site scores every Massachusetts town on exactly those characteristics, and it now holds 10 years of prices, so the list can be tested rather than repeated.
Most of it does not survive.
The trap in the obvious test
Correlate anything with growth and you will find something, because almost every town characteristic correlates with price, and the dominant fact of the last decade is that the cheapest towns grew fastest. A town’s 2016 price alone explains 32% of its growth rate.
So everything here is tested twice: raw, and again after the starting-price effect is stripped out. The second column is the one that matters — it asks whether a characteristic carried any information of its own, or was only ever standing in for how expensive the town already was.
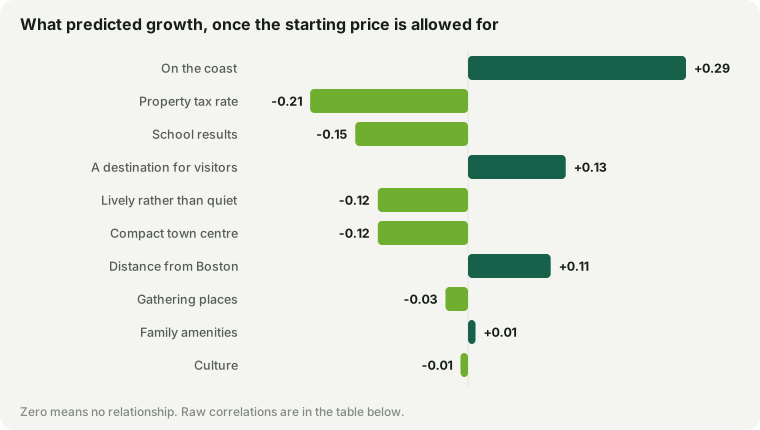
| Characteristic | Raw | After allowing for price |
|---|---|---|
| Property tax rate | -0.13 | -0.29 |
| On the coast | 0.24 | 0.29 |
| School results | -0.54 | -0.15 |
| A destination for visitors | 0.07 | 0.13 |
| Lively rather than quiet | -0.05 | -0.12 |
| Compact town centre | -0.03 | -0.12 |
| Distance from Boston | 0.39 | 0.1 |
| Gathering places | -0.06 | -0.03 |
| Family amenities | -0.25 | 0.01 |
| Culture | -0.06 | -0.01 |
Correlation with the 10-year growth rate across 223 towns. Zero means no relationship.
The character measures predict nothing
Take the six that describe what a town is like to live in. The strongest of them manages 0.13 once price is allowed for — which is nothing.
| Town character | After allowing for price |
|---|---|
| A destination for visitors | 0.13 |
| Lively rather than quiet | -0.12 |
| Compact town centre | -0.12 |
| Gathering places | -0.03 |
| Family amenities | 0.01 |
| Culture | -0.01 |
Family amenities is the instructive one. Raw, it looks like a real negative signal at -0.25 — towns with more of them grew more slowly. Allow for price and it goes to 0.01. The apparent effect was never about amenities. Towns with lots of family amenities are expensive towns, and expensive towns grew slowly. Remove the price and nothing is left.
The same is true of a compact centre, of culture, of gathering places. Whatever those things do for a town — and they may be exactly why you want to live there — they did not move the price over this decade beyond what the price already predicted.
One thing survives: the water
Being on the coast is the largest surviving relationship in the table, and it gets stronger rather than weaker once price is accounted for, from 0.24 to 0.29. It also holds inside every price band, which is the test that matters — coastal towns beat inland towns at every level of expense.
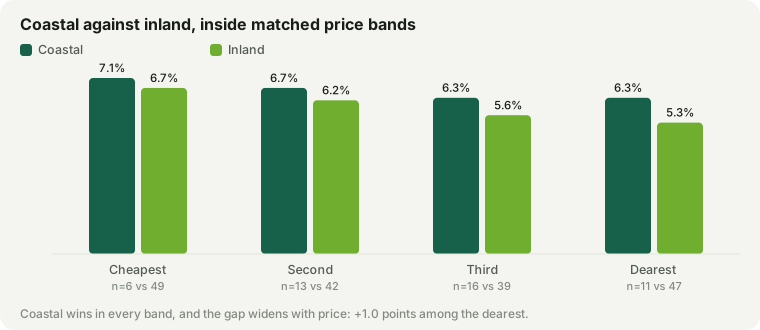
| Towns by 2016 price | Coastal | Inland | Difference |
|---|---|---|---|
| Cheapest quarter | 7.1% (6) | 6.7% (49) | +0.4 pt |
| Second | 6.7% (13) | 6.2% (42) | +0.5 pt |
| Third | 6.3% (16) | 5.6% (39) | +0.7 pt |
| Dearest quarter | 6.3% (11) | 5.3% (47) | +1.0 pt |
The gap widens as the towns get dearer, reaching 1.0 points a year in the dearest quarter and compounding over 10 years. Among expensive towns, being on the water was the difference between an ordinary decade and a good one.
One other line in the table looks like a finding and is not. The property tax rate comes out at -0.29 — higher-rate towns grew more slowly — but a tax rate is the levy divided by the town’s total assessed value, and the rate here is this year’s, measured at the end of the decade rather than the start. A town that appreciated sharply had its denominator grow under it, which pushes the rate down on its own. That number is a consequence of the growth, not a predictor of it, and it is left out of the conclusions below.
Is it just Cape Cod?
Partly, and it is worth separating. The Cape towns grew at a median 7.0%, the strongest of the three groups and strikingly uniform — every one of the 10 landed between 6.5% and 7.3%. But coastal towns off the Cape still managed 6.3% against 5.9% inland, so the Cape is the sharp end of a real pattern rather than the whole of it.
| Cape Cod town | A year | 2016 → 2026 |
|---|---|---|
| Chatham | 7.3% | $663k → $1,347k |
| Falmouth | 7.2% | $433k → $868k |
| Sandwich | 7.2% | $349k → $701k |
| Dennis | 7.2% | $343k → $686k |
| Barnstable | 7.0% | $372k → $732k |
| Yarmouth | 7.0% | $310k → $610k |
| Harwich | 6.9% | $398k → $773k |
| Brewster | 6.9% | $411k → $800k |
| Bourne | 6.8% | $348k → $671k |
| Mashpee | 6.5% | $381k → $717k |
The likeliest explanation is not that water is magic but that this particular decade contained a shock that favoured it. Remote work arrived in 2020 and turned a second home into a plausible first one, and the Cape absorbed a wave of demand it had no supply for. That is a historical event, not a law — which is exactly why the surviving finding should be read as an explanation of the past decade rather than a tip for the next.
What to take from it
- Buy the town you want to live in. The character measures did not predict appreciation, which means choosing a walkable centre or a lively high street costs you nothing in expected growth — and gains you the thing itself.
- Do not pay a premium for “up and coming”. Nothing in the character of a town gave a usable signal here. The one variable that did was starting price, and its message was that being cheap is what preceded fast growth — which is a description of recovery, not a strategy.
- Treat schools separately. Strong districts grew more slowly in percentage terms and gained far more in dollars. Schools are a reason to buy a town; they were not a growth engine over this decade.
How this was measured
The 10-year growth rate from the Zillow Home Value Index for 223 Massachusetts municipalities, tested against this site’s six town-character scores, the district MCAS percentile, distance from Boston, the residential tax rate and whether the ocean reaches the town. Boston’s neighbourhoods are excluded: they share the citywide price series. Correlations are Pearson’s r. The second column is the correlation with growth after a least-squares fit on the 2016 price has been subtracted — the part of a town’s growth its starting price does not account for.
One decade is one cycle, and this one was unusual at both ends: it starts in the recovery from the housing crash and includes the pandemic. Nothing here identifies a cause; a correlation that survives a control is a fact about this period, not a mechanism. Figures as of September 17, 2026. Every town’s ten-year chart and character scores are on its page in the town finder.