The cheapest towns grew fastest and almost never fell. Nearly half the dearest did.
The cheapest Massachusetts towns grew fastest over the last decade, and the usual assumption is that they took more risk to do it. They took less. Only 2 of the 56 cheapest towns had a single year in which prices fell, against 26 of the 55 dearest. Volatility barely depends on price, so growth per unit of it falls from 1.36 to 1.01. The real swings were on Cape Cod, home to 7 of the ten most volatile towns. There was no crash in these years, and the piece says so first.
This site has already shown that the cheapest Massachusetts towns grew fastest over the last decade. That is half of any investment question. The other half is how bumpy the ride was — and the usual assumption is that the cheap towns paid for their growth with more of it.
One thing first, because it governs everything below. There was no crash in these ten years. Of 223 towns, 171 never had a single year in which prices fell. “Risk” here means the size of the bumps in a rising decade, not what a real correction would do, and nothing on this page is a forecast of one.
The cheapest towns almost never fell
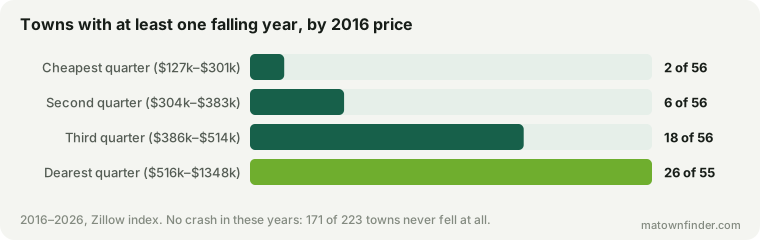
Split the towns into quarters by what a home cost in 2016. In the cheapest quarter — $127k to $301k then — 2 of 56 towns had a falling year at any point in the decade. In the dearest, 26 of 55 did. By school tier the gradient is the same: 12 of the 23 Tier 1 towns fell in at least one year, against 7 of the 46 in Tier 4.
Across all towns, the dearer the town, the worse its worst year (r = −0.54). The median worst year was +1.6% in the cheapest quarter and +0.2% in the dearest.
Faster, and no bumpier
The swings themselves barely depend on price: volatility, the spread of a town’s yearly changes around its own average, rises only slightly with what homes cost (r = 0.16). What differs is what each town delivered for its swings. The cheap towns grew faster with about the same bumpiness, so their growth per unit of volatility is far higher — and it falls steadily as towns get dearer.
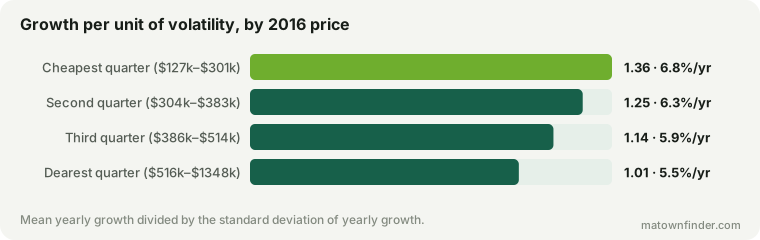
In the cheapest quarter, a typical town grew 6.82% a year with a volatility of 5.19 points; in the dearest, 5.51% with 5.59. Growth per unit of volatility runs from 1.36 to 1.01, and across every town the link with price is strong (t = −14.0). It is not the coast doing it: inland towns alone show the same thing (t = −13.9).
Where the bumps were: the Cape
If any part of the state carried real price risk this decade, it was Cape Cod. The median Cape town’s volatility was 7.99, against 5.29 for the rest of the coast and 5.02 inland, and 7 of the ten most volatile towns in the state are on it: Falmouth, Chatham, Brewster, Mashpee, Dennis, Yarmouth, Barnstable. The Cape is the state’s largest second-home market, and second homes are bought with money that comes and goes with the economy — the likeliest explanation, though this site holds no figure for second homes and cannot test it. At the other end, 5 of the 6 steadiest towns are in the Pioneer Valley — Easthampton, Northampton, Agawam, Amherst, South Hadley.
For what the Cape offers in exchange, its taxes and schools are compared here.
Doesn’t an earlier piece say the opposite?
It can look that way. Another study here found that in the decade’s weakest year, 2022–23, the top school tier did better than its prices predicted. Both are true, because they answer different questions. That piece held price fixed and asked how the strong districts did against other towns at the same price. This one asks how dear towns did in absolute terms. In 2022–23 the dear towns as a group grew least, and the strong districts among them grew least slowly.
Nor is this that one year. Only 111 of the 223 towns had their worst year in 2022–23; the rest had it in some other year. Remove 2022–23 from every town’s history and the link between price and the worst year is unchanged (r = −0.54).
What this cannot tell you
- How a crash would go. There is none in this data. A decade of rising prices says little about which towns would fall furthest in a real downturn.
- Exact volatility for any one town. Ten yearly changes is a small sample, and Zillow’s index is smoothed, which flattens swings. The quarter medians are the reliable figures; a single town’s number is a rough guide.
- That cheap towns are safe. They were steady over one particular decade, when the cheapest housing in the state was in heaviest demand. That is a description of what happened, not a property of cheap housing.
How to use this
- Don’t assume the dear town is the safe one. Over this decade the opposite was true: the dearest towns had the deepest bad years.
- If you are buying on the Cape, expect the swings. Over this decade its prices moved further, year to year, than anywhere else in the state.
- Read one year as one year. A single year’s ranking predicts very little, in either direction.
How this was measured
Prices are the Zillow Home Value Index, all homes, at the town level, taken at mid-year from 2016 to 2026: 10 yearly changes for each of 223 towns with a complete series. Volatility is the sample standard deviation of a town’s yearly percentage changes; growth per unit of volatility is the mean change divided by it. Quarters are by the 2016 value, and figures are medians. Boston’s neighborhoods share the city’s series and count once. See the methodology, or download the tables. Figures as of October 9, 2026.