Before 2020, density paid. Since, it has cost.
People per square mile, set against ten years of Massachusetts prices with the drive to Boston, the starting price and the coast held fixed. Before 2020, denser towns grew faster: a town ten times as dense gained about 0.72 points a year. In 2020–21 that reversed, 4.4 points slower in a single year, and since 2020 the same town has grown 1.17 points a year slower. It partly revises an earlier piece here, which called density distance in disguise.
Every town page here gives a density: people per square mile, from the census population and the town’s area. It runs from 160 in the emptiest towns to 19,652 in Somerville, with a median of 965. This piece sets it against ten years of Zillow’s index and asks one question of each year: at the same distance from Boston, the same price going in and the same coastline, did denser towns grow faster or slower?
The answer changed sign in 2020
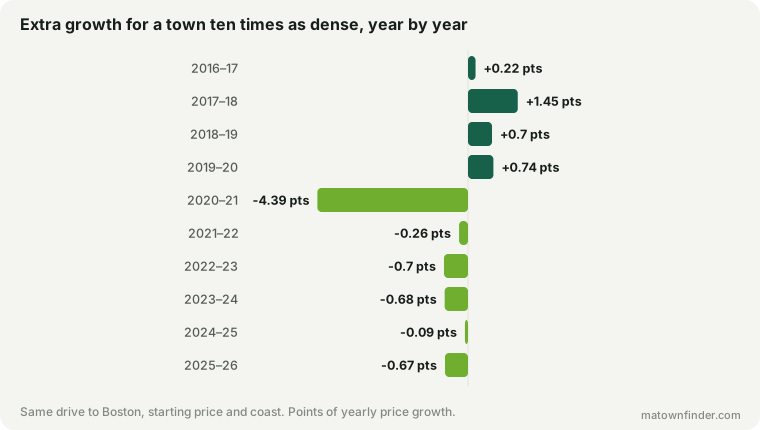
In three of the four years before 2020, denser towns grew faster than towns like them in every other respect. Then, in 2020–21, the sign flipped hard: a town ten times as dense grew 4.4 points less that year (t = −8.4), the largest effect of density in any year of the decade. In three of the five years since, denser towns have again grown measurably more slowly, by less; in none have they grown measurably faster.
Over the two halves: from 2016 to 2020, ten times the density meant +0.72 points of growth a year; from 2020 to 2026, −1.17.
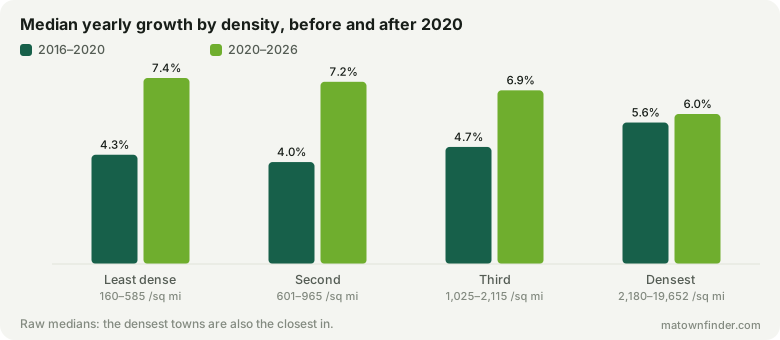
The raw picture says the same thing more bluntly. Before 2020 the densest quarter of towns grew fastest, 5.62% a year against 4.34% for the least dense. Since 2020 it has grown slowest, 5.96% against 7.39%.
Why every year, and not two halves
Because the reversal sits in a single year, the answer you get from two halves depends on where you cut. Split at 2020 and the halves differ sharply. Split at 2021 and the first half absorbs the reversal and nearly cancels out (−0.27 points, t = −1.7). Any single cut can be chosen to tell the story you want, so the chart at the top shows every year.
Checks
- Ten densest cities removed (213 towns): +0.56 a year before 2020 (t = 4.0), −0.91 after (t = −5.3).
- Under 40 minutes from Boston (29 towns): +2.32 a year before 2020 (t = 4.7), −2.13 after (t = −2.3).
- 40 minutes or more (194 towns): +0.31 a year before 2020 (t = 1.9), −0.42 after (t = −2.4).
- Inland towns only (177 towns): +0.74 a year before 2020 (t = 5.0), −1.26 after (t = −7.1).
It holds without the densest cities and on inland towns alone. It is strongest close in: among towns under 40 minutes from Boston it is several times the size it is further out, where it is weak before 2020 and modest after.
What this changes about an earlier piece
The piece on the pandemic boom tested density and concluded that it was distance “wearing different clothes”. It measured density with the 1–10 compactness score from the town profiles. Measured as actual population density, the answer moves. Over that piece’s own boom years, 2019 to 2022, the compactness score correlated with the boom at r = −0.28; population density does at −0.45, against 0.56 for the drive to Boston. And with both in one model, each keeps its own effect: density at t = −4.7, the drive at t = 3.3.
So the earlier conclusion was half right. Density and distance overlap heavily — the dense towns are the close-in ones (r = −0.52) — and further out the density effect fades. But they are not the same thing, and close to Boston density mattered on its own.
What this is not
- Not a cause. Density stands for everything that comes with it — smaller homes, less outdoor space, more renters, a city’s budget. The data cannot say which of those buyers were pricing in 2020.
- Not a forecast. The pre-2020 premium for density might return. Nothing here says whether it will.
- Not within a town. A dense village centre inside a spread-out town looks spread-out here.
How to use this
- Don’t project the last six years forward. The decade has had both regimes. Which one comes next is a bet.
- Compare like with like. A dense inner suburb and a spread-out exurb had different decades for reasons this piece can measure; set a town against towns of similar density.
- Read it beside the price story. Cheap towns grew fastest; this is the other thing that sorted the decade.
How this was measured
Density is census population over town area, as on each town page. Prices are the Zillow Home Value Index, all homes, at mid-year from 2016 to 2026, for 223 towns with a complete series. Each year’s growth, and each half’s compound annual growth, is modelled by least squares on log density, the drive to Boston, the log price at the start of the period and a coastal indicator; the density coefficient is reported per tenfold difference. Boston’s neighborhoods share the city’s series and count once. See the methodology, or download the tables. Figures as of October 9, 2026.