At the same house price, the bigger district scores fifteen points lower
Among the 77 Massachusetts towns where a house costs $600,000 to $800,000, the smaller half of districts — a median of 1,813 pupils — average 56.5% of students meeting expectations. The larger half, a median of 4,914, average 41.0%. The size of the school a child actually attends explains none of it (t = −1.3); the size of the district around it survives controls for price, commute and spending, and survives dropping the ten biggest districts outright.
The argument running under most of the school writing here is that a district’s test score mostly measures the families who moved in, and that what a strong district adds to a house price is large and measurable. So the interesting question is what is left once price is held fixed. Across the 223 districts here, one thing is: size.
Same price, fifteen points apart
Take the 77 towns where a house costs between $600k and $800k and split them at the middle by how many pupils the district enrols. Both halves have a median house price of $700k.
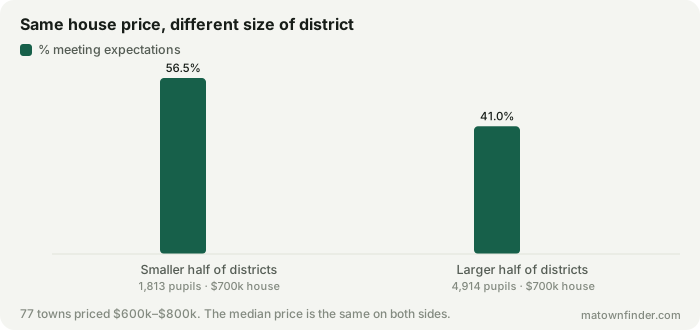
The smaller half — a median of 1,813 pupils — averages 56.5% of students meeting expectations. The larger half, a median of 4,914, averages 41.0%. That is a gap of 15.5 points between towns whose houses cost the same.
It is the district, not the school
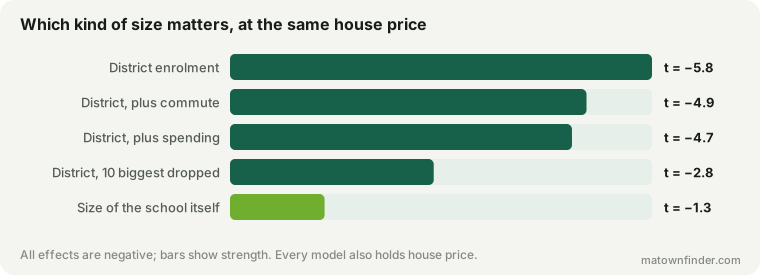
“Size” could mean two different things, and only one of them does any work. The school a child actually walks into ranges from 175 pupils to 981 across these towns, with a typical school of 403. Put that in a model with price and it explains nothing: t = −1.3.
The district’s total enrolment does. Every time a district is 2.7 times bigger, it sits about 8.8 points lower on the same measure at the same house price (t = −5.8). Districts here run from Nahant’s 270 pupils to Boston’s 60,359, with a median of 2,786.
Three attempts to kill it
- Big districts are cities. Add the drive to Boston and district size holds at t = −4.9.
- Big districts might spend less. Add spending per pupil: t = −4.7. (The spending term comes out negative, reproducing a result this site has already explained: the state directs the most aid where the need is greatest, so spending follows low scores rather than causing them.)
- It might just be Boston, Worcester and Springfield. Drop the ten largest districts entirely and the remaining 213 still show it: t = −2.8.
Why you cannot just read this off a table
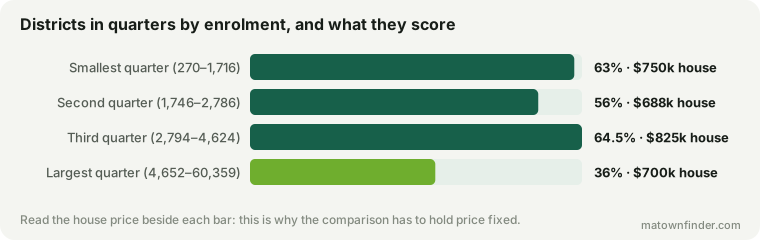
Sorted into quarters by enrolment, the scores go 63, 56, 64.5, 36 — up, down, then off a cliff. That is not a tidy gradient, and the reason is in the column beside it: the median house price moves between the quarters too ($750k, $688k, $825k, $700k). The size effect only reads cleanly once price is held still, which is what the matched comparison at the top of this piece does and what the raw table cannot.
What this does not mean
It does not mean a big district teaches worse, and the reason is worth being precise about rather than waving at. A town’s median house price is a blunt stand-in for the incomes of the families in its schools, and it is blunt in one particular direction: a city with a $700k median contains far more poverty than a suburb with a $700k median, because the suburb’s distribution is narrow and the city’s is wide. Concentrated low income is the most likely explanation of this gap, and nothing in this data can separate it from anything a district does or fails to do.
What the finding is about is the number a family inherits when they shortlist on a published score. If you compare two towns at the same price and one has a district four times the size, the larger one will on average show a markedly lower score — and most of that is about who lives there, not about the building your child would walk into.
How to use this
- Compare districts of similar size. Setting a 20,000-pupil city against a 2,000-pupil town on a district average is not a like-for-like comparison, whatever the houses cost.
- In a large district, the average hides more. This site has shown that a town rating can be an average of up to seventy-eight schools. The bigger the district, the less the single number tells you about the one school you would be zoned for.
- Ask for the school, not the town. The state publishes results building by building, and in a large district that is the figure that matters.
How this was measured
District enrolment and spending per pupil are the state’s figures as carried on each town page; the score is the share of students meeting or exceeding expectations on MCAS. School size is the median enrolment of the town’s elementary and elementary/middle schools, counting only those with at least 100 pupils, because the smaller entries are specialty and alternative programmes rather than neighbourhood schools and including them makes a “typical school” meaningless. Models are least squares with log enrolment, log house price, the drive to Boston and log spending per pupil. Boston’s neighborhoods share the city’s district and count once. See the methodology, or download the tables. Figures as of October 9, 2026.