Where the commuter rail is slower than driving
Every rapid-transit town beats the car, by a median of 16 minutes. On the commuter rail only 48 of 73 do — and from Fall River the train takes 21 minutes longer than the drive.
A station near the house does two things in a buyer’s head at once. It promises a faster way in than the road, and it feels like something you are paying for. Neither survives contact with the timetable as cleanly as you would hope.
Of the 223 Massachusetts municipalities this site covers, 83 have a rail option and a measured peak drive to compare it against. The train is the faster trip from 58 of them — 70% — and the slower trip from 21.
Rapid transit always wins. The commuter rail often does not.
Split the two systems apart and the average stops being useful, because they are not the same proposition at all.
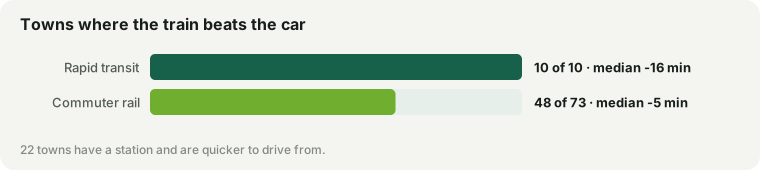
| Line | Towns | Train is faster | Median difference |
|---|---|---|---|
| Rapid transit | 10 | 10 of 10 | -16 min |
| Commuter rail | 73 | 48 of 73 | -5 min |
Every one of the 10 rapid-transit towns beats the car, and by a lot: a median of 16 minutes saved. That is what a dedicated right of way buys — the train is not sitting in the traffic that is slowing you down.
The commuter rail is a different animal. It wins in 48 of 73 towns, and its median saving is 5 minutes — small enough that a single connection at the far end erases it.
Where the train loses
21 towns have a station from which driving is quicker. These are not marginal losses.
| Town | Drive | Train | Train costs you | Median 4BR |
|---|---|---|---|---|
| Fall River | 82 min | 103 min | +21 min | $450k |
| Freetown | 78 min | 96 min | +18 min | $625k |
| Fitchburg | 80 min | 91 min | +11 min | $420k |
| Westborough | 66 min | 76 min | +10 min | $950k |
| Leominster | 76 min | 84 min | +8 min | $500k |
| Waltham | 36 min | 44 min | +8 min | $1000k |
| New Bedford | 86 min | 94 min | +8 min | $475k |
| Worcester | 77 min | 84 min | +7 min | $550k |
From Fall River the train takes 21 minutes longer than the drive. A station on the map is not a fast way in; it is a way in that happens to run on rails, and on the long southern and western lines the road is simply quicker at peak.
The other end of the list is where the promise holds. Quincy saves 23 minutes, Braintree 21, Medford 20 — all of them rapid transit or a short inner stretch of rail.
| Town | Drive | Train | Train saves | Median 4BR |
|---|---|---|---|---|
| Quincy | 37 min | 14 min | 23 min | $875k |
| Braintree | 46 min | 25 min | 21 min | $875k |
| Medford | 28 min | 8 min | 20 min | $900k |
| Weymouth | 47 min | 28 min | 19 min | $725k |
| Somerville | 23 min | 6 min | 17 min | $1250k |
| Malden | 28 min | 11 min | 17 min | $700k |
| Cambridge | 22 min | 6 min | 16 min | $1700k |
| Attleboro | 70 min | 54 min | 16 min | $620k |
What the station costs, and what that number is made of
Now the second assumption. Towns with rail have a median 4BR of $850k against $700k without — a gap of $150k that looks exactly like the premium everyone assumes they are paying.
It is not one. Rail in Massachusetts runs where the population already is, so a rail town is on average a closer-in town, and closeness is the most expensive thing on this map. Split by distance and the gap does not merely shrink — in the middle band it inverts.
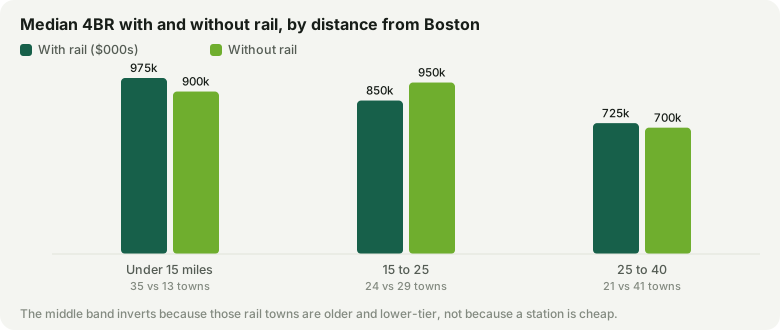
| From Boston | With rail | Without | Difference | Median school tier |
|---|---|---|---|---|
| Under 15 miles | $975k (33) | $875k (12) | +$100k | 3 vs 3 |
| 15 to 25 | $850k (25) | $925k (32) | −$75k | 3 vs 2 |
| 25 to 40 | $750k (22) | $688k (42) | +$63k | 3 vs 3 |
Between 15 to 25 miles out, the rail towns are $75k cheaper than the ones without. That looks like a bargain and it is mostly an illusion of a different kind: look at the last column. In that band the rail towns sit at a median school tier of 3 and the car-only towns at 2. You are not comparing the same town with and without a station. You are comparing the old mill towns strung along the lines with the newer suburbs built between them.
Hold distance and school tier together and the station stops mattering almost entirely:
| From Boston | Tier | With rail | Without | Difference |
|---|---|---|---|---|
| 15 to 25 | 2 | $1000k (8) | $950k (14) | +$50k |
| 15 to 25 | 3 | $775k (11) | $750k (10) | +$25k |
| 25 to 40 | 2 | $900k (3) | $900k (7) | — |
| 25 to 40 | 3 | $775k (11) | $663k (26) | +$113k |
| 25 to 40 | 4 | $550k (6) | $575k (5) | −$25k |
These cells are small — the counts are in brackets and some are three towns against six, which is not enough to trust a single figure from. Read them together rather than one at a time, and what they say is that the difference bounces around zero in both directions. The one large number, the Tier 1 cell, rests on three rail towns and is the least reliable line in the table, not the most interesting one.
The honest summary is that a station is roughly free. It is not the premium the raw figure suggests, and it is not the discount the distance-adjusted figure suggests either.
What to do with this
Check the two times for the specific town before you let the station weigh on the decision. On rapid transit it will be a real saving. On the commuter rail it is a coin flip that pays about five minutes when it lands, and from Fall River, Freetown or Fitchburg it costs you time outright.
What a station does buy, and this analysis cannot price, is the option of not driving: a trip you can read or sleep through, one car instead of two, a route that does not degrade on a bad weather day. Those are real. They are just not the same claim as “it is faster”, and only one of the two is on the timetable.
How this was measured
Peak drive times and scheduled rail times to downtown Boston for every town on this site that has both, 83 of 223 municipalities. Boston’s own neighbourhoods are excluded throughout — they all have rapid transit and none of them is the kind of commute decision this is about, so counting them would put sixteen guaranteed wins on the board.
The rail figure is the scheduled in-vehicle time and does not include getting to the station or waiting for a train, so it flatters the train; a drive time is door to door. Both are peak-hour and neither is your Tuesday. Prices are the estimated median 4BR, and school tiers are this site’s own, with Tier 1 strongest. Figures as of September 11, 2026. Every town’s own numbers are on its page in the town finder, and the commute pages break the same data down by destination.