In Amherst, 45% of the residents are dorm beds
This site divides a town’s budget by its census population to get spending per resident — and the census counts a student at their term-time address. Amherst holds 17,593 dorm beds against a population of 39,263, so it spends $2,201 per resident, or $3,988 per resident who does not live in a dorm. Ranked against every town, Williamstown rises 95 places once the beds come out, Wenham 76 and Amherst 54. Neither denominator is the right one, which is the point.
This site publishes a figure called municipal spending per resident. It appears in an article of its own and on the compare page for any two towns, and it is built the obvious way: the town’s budget divided by its census population.
The census counts a college student at their term-time address. In Amherst, that means 17,593 of the 39,263 residents — 44.8% — are dormitory beds. The denominator includes thousands of people the largest line of the budget, the public schools, does not serve.
How far the number moves
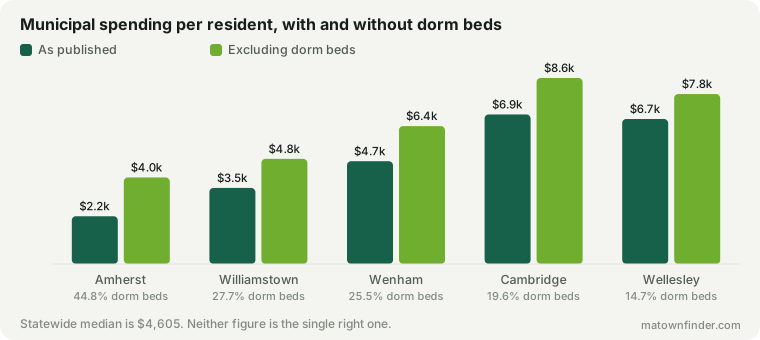
Amherst spends $2,201 per resident, one of the lowest figures in Massachusetts against a statewide median of $4,605. Per resident who does not live in a dorm it is $3,988 — 81% more.
36 of the 219 towns have dormitory beds at all, holding 163,067 between them, and in eight of those more than a tenth of the census population is a dorm bed: Amherst (44.8%), Williamstown (27.7%), Wenham (25.5%), Cambridge (19.6%), Wellesley (14.7%).
It reorders the table
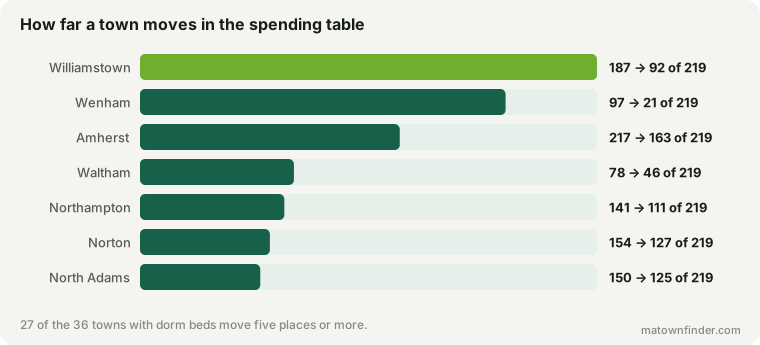
Ranked against every town the site prices, Williamstown rises from 187th to 92nd — 95 places — once its 2,078 dorm beds come out. Wenham moves 76, and Amherst 54. In total 27 towns shift by 5 places or more.
That is the reason this is worth an article. A figure that wobbles by a few percent is a footnote. A figure that moves a town most of the way across a 219-town table is one you cannot read straight.
Which number is right? Neither.
It would be neat to declare the adjusted figure correct and the published one wrong. That is not the case, and the honest answer is more useful.
Students living in dormitories are residents. They walk on the roads, they are covered by the fire department, they call the police, and the town spends real money on them — so dividing by the smaller number overstates spending per person just as surely as the published figure understates it. The two denominators answer two different questions: what the town spends per person present, and what it spends per person in the ordinary residential town underneath the campus.
The point is not that one replaces the other. It is that in 8 towns the gap between them is wide enough to change the answer, and a reader comparing Amherst with a town that has no campus should know which question the number in front of them is answering.
What this is not
- Beds are capacity, not occupancy. The figure is dormitory capacity reported by each institution, summed across campuses. A bed empty this year still counts, so the adjustment here is an upper bound on the correction.
- It is not a claim about students. Nothing here says a college town is worse to live in or that campuses cost a town money on balance. They bring employment, and this data says nothing about the trade.
- Other per-resident figures inherit it. Any statistic on this site or elsewhere with a census population underneath it carries the same distortion in the same towns.
How to use this
- Check for a campus before trusting a per-resident figure. If the town has one, the number is describing a population that includes it.
- Compare college towns with college towns. Amherst against Williamstown is a fair comparison; Amherst against a commuter suburb is not.
- For schools, use the per-pupil figure instead. Spending per pupil has enrolment underneath it rather than population, so dormitories cannot touch it — though it has problems of its own.
How this was measured
Spending per resident is the town’s FY2025 municipal budget over its census population, exactly as the site publishes it. Dormitory beds are the capacity reported by the institutions in each town, summed where a town has more than one campus. The adjusted figure divides the same budget by the population less those beds. Rankings are across the 219 municipalities with both a budget and a population; Boston’s neighborhoods share the city’s budget and are not ranked separately. See the methodology, or download the tables. Figures as of October 9, 2026.